New: NextGenTemplates Academy - video courses on Excel formulas with AI and Pivot Tables & dashboards. Early-bird: 20% off with code EARLYBIRD20 - first 20 orders only. See the courses →
  • Learn Excel (Free Course)
    • 1. Shortcut Keys
    • 2. Fill & Flash Fill
    • 3. Find & Replace
    • 4. Sort & Filter
    • 5. Formulas & Functions
    • 6. Data Validation
    • 7. Conditional Formatting
    • 8. Basic Charts
    • 9. Advanced Charts
    • 10. Pivot Tables
    • 11. Excel Dashboards
    • 12. VBA Course
    • 13. Excel Formulas with AI
  • Templates
  • Tutorials
    • Charts and Visualization
    • VBA
    • Excel Tips and Tricks
    • Excel Dashboards
    • Power Pivot & DAX
  • Power BI
  • Template Store
    • Ready to Use Templates
  • Courses
  • Academy
    • Excel + AI Mastery: 100 Formulas
    • Excel Pivot Tables & Dashboards
  • About Us
  • Contact Us

PK: An Excel Expert

Transforming Data into Decisions

Tag: Region Analysis

Dashboard Power BI

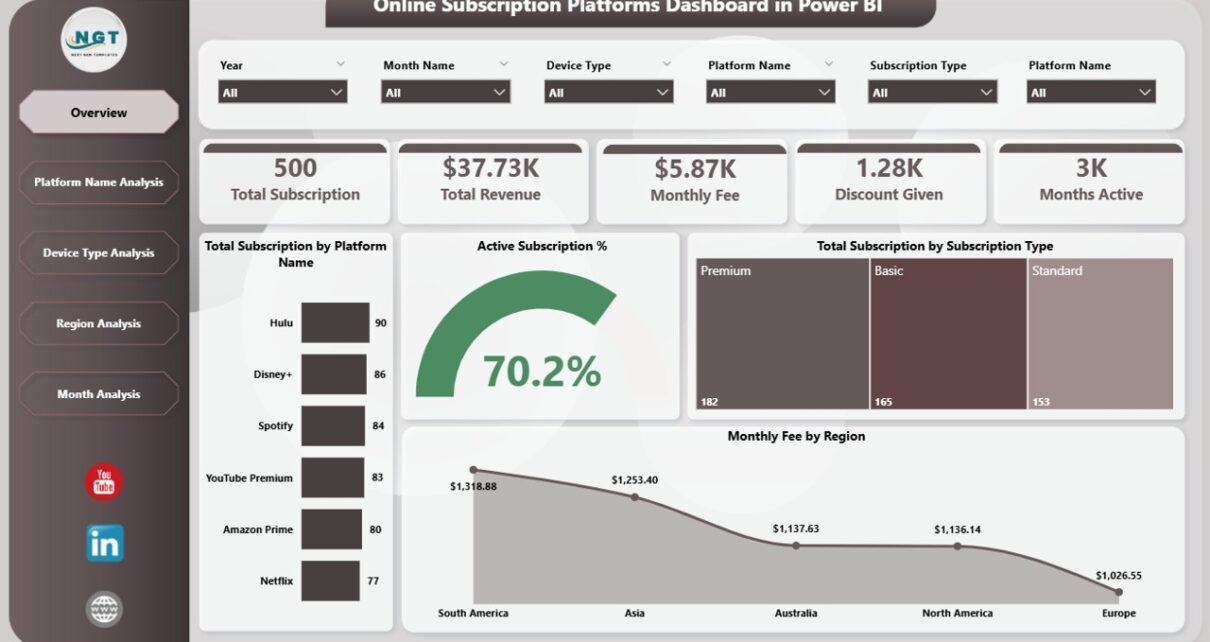
Online Subscription Platforms Dashboard in Power BI

March 3, 2026March 3, 2026 PKComments Off on Online Subscription Platforms Dashboard in Power BI
In today’s digital economy, subscription-based businesses dominate the market. Streaming platforms, SaaS tools, learning apps, fitness memberships, and digital services generate recurring revenue every month. However, many businesses still track
Read More
Dashboard

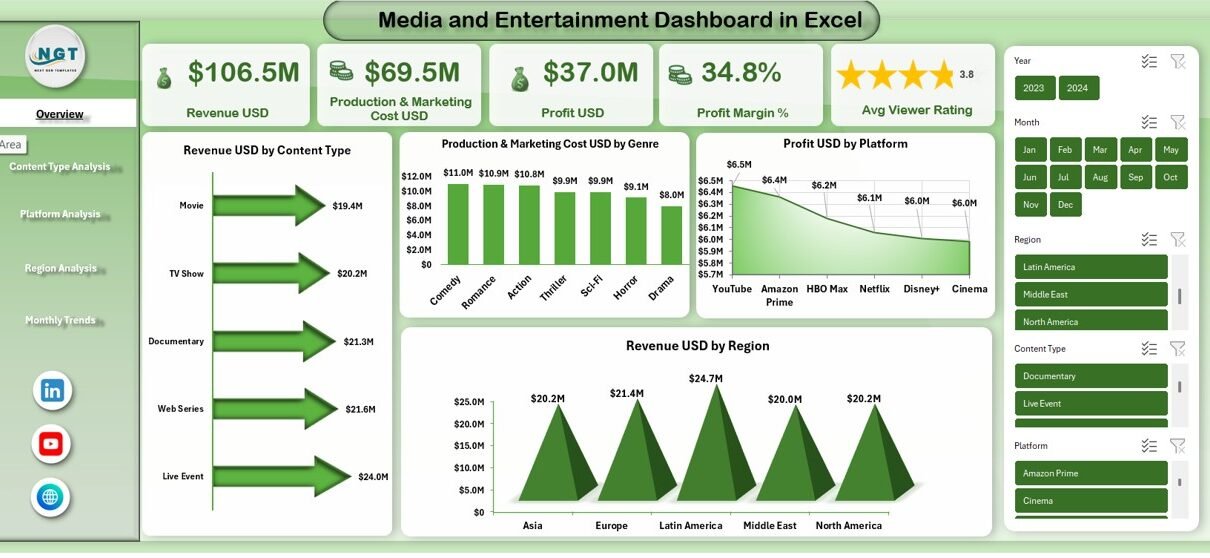
Media and Entertainment Dashboard in Excel

December 22, 2025December 22, 2025 PKComments Off on Media and Entertainment Dashboard in Excel
Media and entertainment businesses move fast. Every day, studios, OTT platforms, broadcasters, and digital creators track revenue, costs, ratings, views, and audience engagement. However, when data stays scattered across multiple
Read More
Dashboard

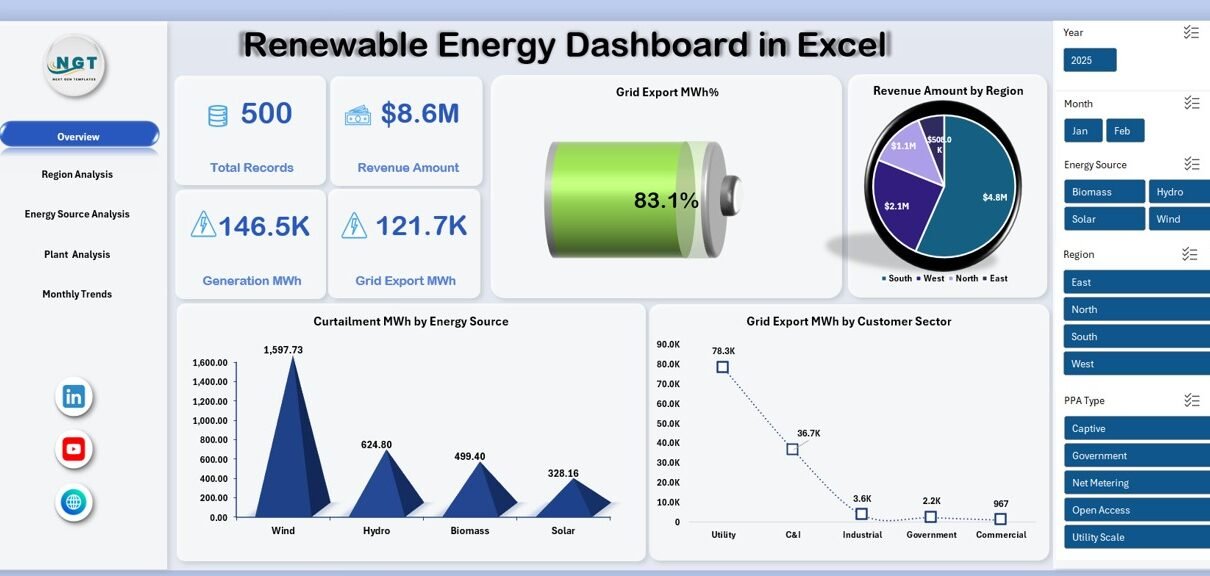
Renewable Energy Dashboard in Excel

December 12, 2025December 12, 2025 PKComments Off on Renewable Energy Dashboard in Excel
Renewable energy projects grow rapidly across the world. However, managing data from solar, wind, hydro, and other renewable sources often becomes complex. Multiple plants, regions, customer sectors, and PPA types
Read More
Dashboard Power BI

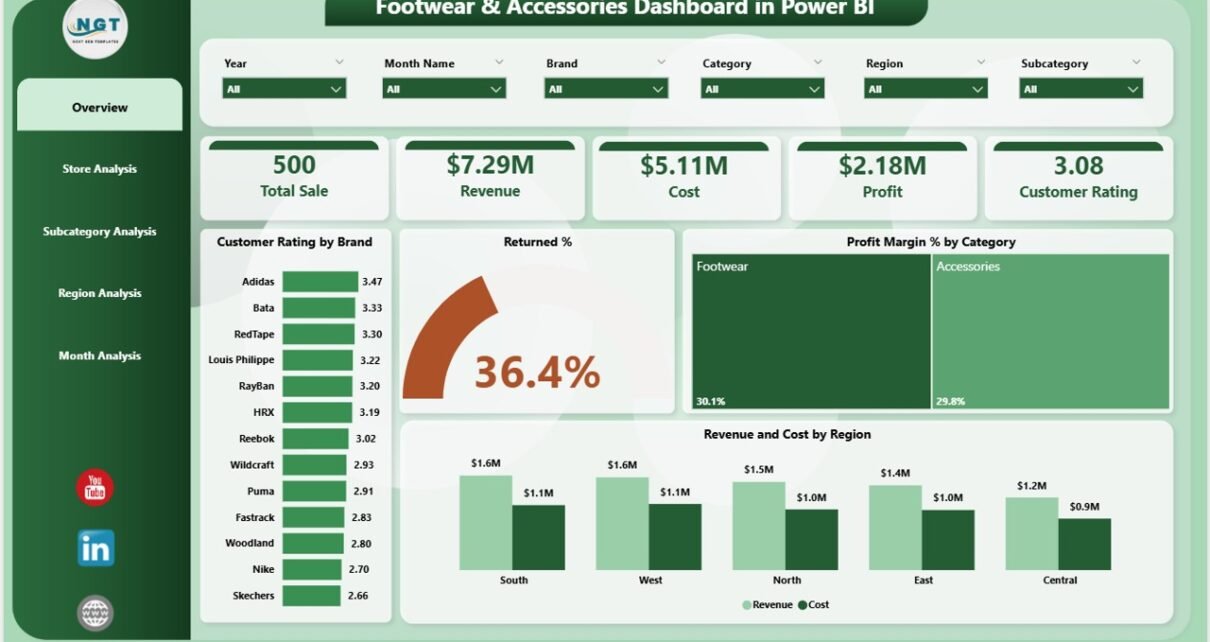
Footwear & Accessories Dashboard in Power BI

November 28, 2025November 28, 2025 PKComments Off on Footwear & Accessories Dashboard in Power BI
The footwear and accessories market grows every year. Customers want stylish shoes, durable bags, trendy belts, and many other fashion items. Because of this, retailers need the right insights to
Read More
Dashboard Power BI

Actuarial Services Dashboard in Power BI

November 27, 2025November 27, 2025 PKComments Off on Actuarial Services Dashboard in Power BI
Businesses in the insurance and financial sectors rely on data to make confident decisions. However, raw actuarial data often looks confusing, unorganized, and hard to explore. That is why many
Read More
Dashboard Power BI

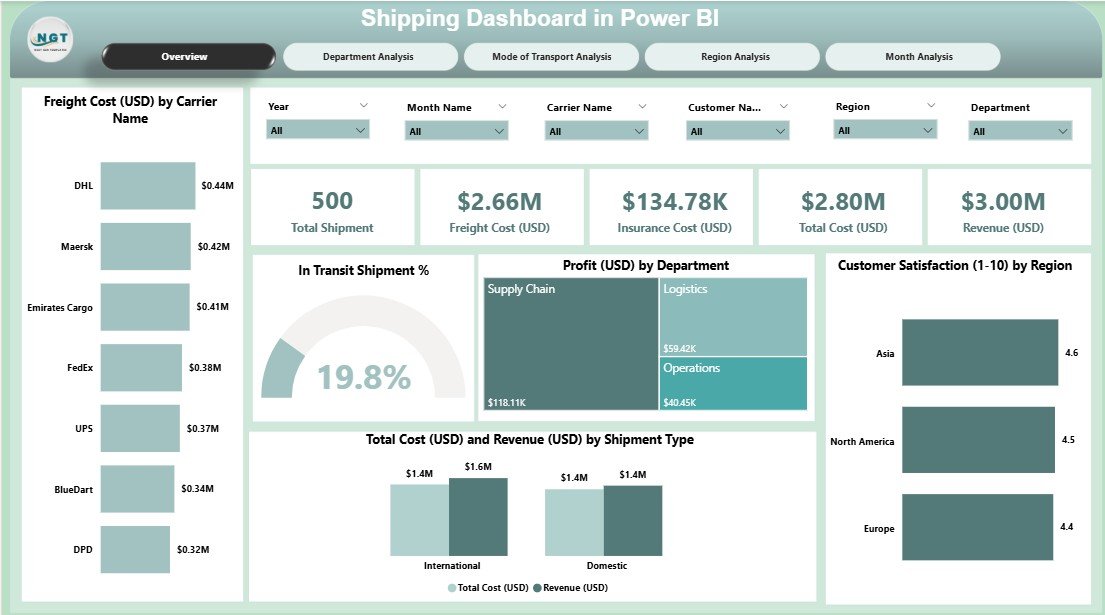
Shipping Dashboard in Power BI

November 13, 2025November 13, 2025 PKComments Off on Shipping Dashboard in Power BI
Logistics leaders work every day to reduce delivery delays, control shipping costs, and improve customer satisfaction. But when shipment data sits in multiple systems or scattered spreadsheets, decision-makers cannot see
Read More
Dashboard

Grocery Delivery Services Dashboard in Excel

November 7, 2025November 7, 2025 PKComments Off on Grocery Delivery Services Dashboard in Excel
In today’s fast-moving retail environment, the success of grocery delivery businesses depends on efficiency, speed, and customer satisfaction. With multiple delivery partners, regions, and payment modes, analyzing operational performance can
Read More
Dashboard Power BI

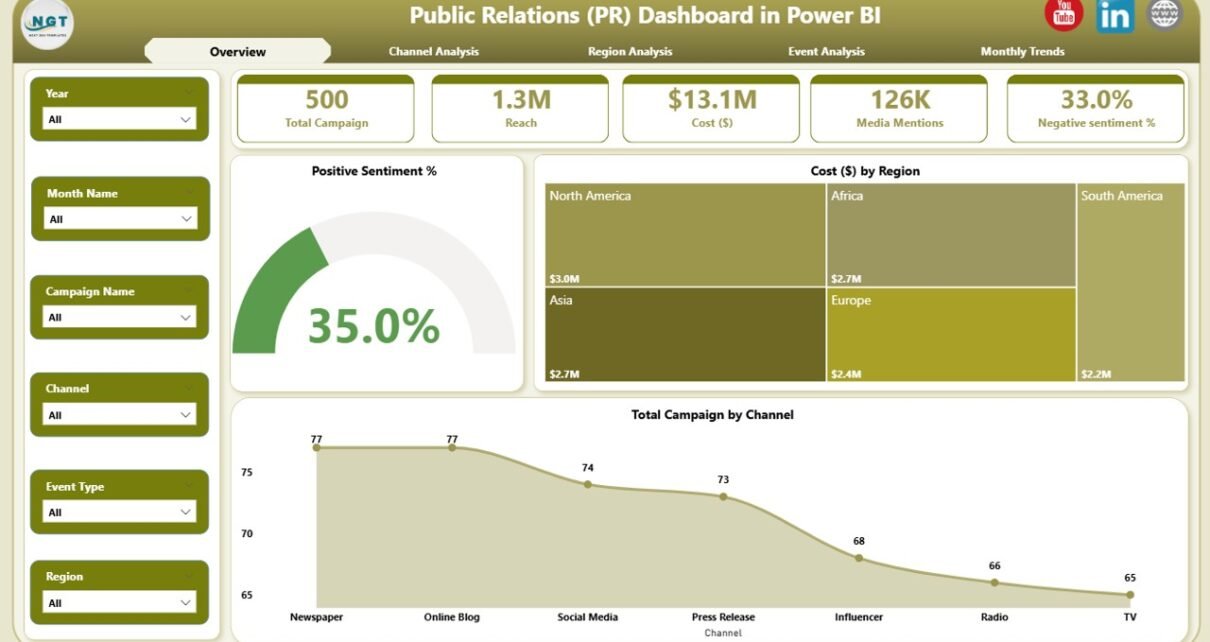
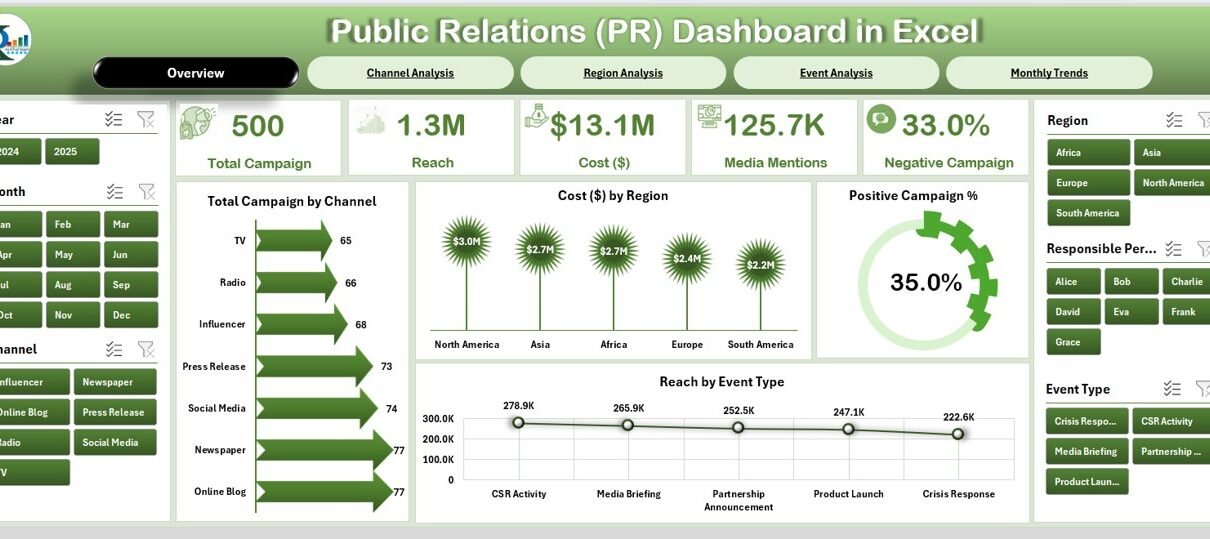
Public Relations (PR) Dashboard in Power BI

October 18, 2025October 18, 2025 PKComments Off on Public Relations (PR) Dashboard in Power BI
In today’s fast-moving digital era, Public Relations (PR) plays a key role in shaping brand image, driving engagement, and maintaining credibility. Every campaign, event, and media mention contributes to how
Read More
Dashboard Power BI

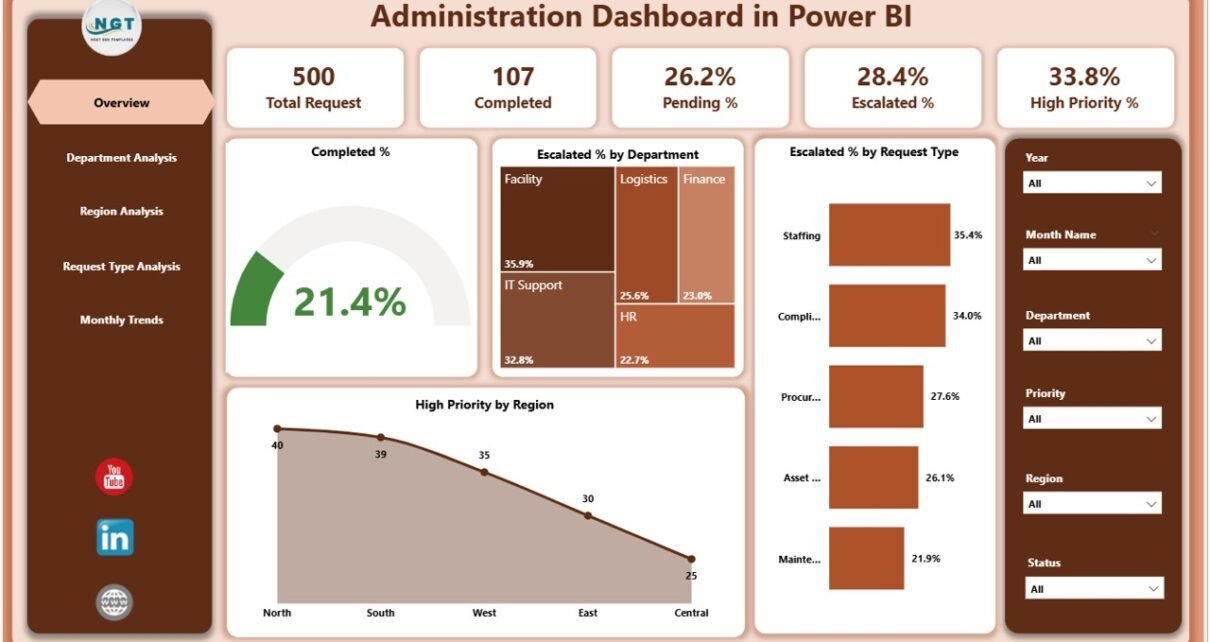
Administration Dashboard in Power BI

October 16, 2025October 16, 2025 PKComments Off on Administration Dashboard in Power BI
In today’s data-driven organizations, efficient administration is not just about managing operations — it’s about making informed, real-time decisions that drive productivity, accountability, and performance. The Administration Dashboard in Power
Read More
Dashboard

Public Relations Dashboard in Excel

September 24, 2025September 24, 2025 PKComments Off on Public Relations Dashboard in Excel
Public Relations (PR) is no longer about sending out press releases or waiting for journalists to pick up a story. In today’s fast-paced world, PR teams must track campaigns, measure
Read More

Posts pagination

1 2 Next
  • Learn Excel (Free Course)
    • 1. Shortcut Keys
    • 2. Fill & Flash Fill
    • 3. Find & Replace
    • 4. Sort & Filter
    • 5. Formulas & Functions
    • 6. Data Validation
    • 7. Conditional Formatting
    • 8. Basic Charts
    • 9. Advanced Charts
    • 10. Pivot Tables
    • 11. Excel Dashboards
    • 12. VBA Course
    • 13. Excel Formulas with AI
  • Templates
  • Tutorials
    • Charts and Visualization
    • VBA
    • Excel Tips and Tricks
    • Excel Dashboards
    • Power Pivot & DAX
  • Power BI
  • Template Store
    • Ready to Use Templates
  • Courses
  • Academy
    • Excel + AI Mastery: 100 Formulas
    • Excel Pivot Tables & Dashboards
  • About Us
  • Contact Us
Copyright © 2023 PK-AnExcelExpert.com - Privacy Policy