New: NextGenTemplates Academy - video courses on Excel formulas with AI and Pivot Tables & dashboards. Early-bird: 20% off with code EARLYBIRD20 - first 20 orders only. See the courses →
  • Learn Excel (Free Course)
    • 1. Shortcut Keys
    • 2. Fill & Flash Fill
    • 3. Find & Replace
    • 4. Sort & Filter
    • 5. Formulas & Functions
    • 6. Data Validation
    • 7. Conditional Formatting
    • 8. Basic Charts
    • 9. Advanced Charts
    • 10. Pivot Tables
    • 11. Excel Dashboards
    • 12. VBA Course
    • 13. Excel Formulas with AI
  • Templates
  • Tutorials
    • Charts and Visualization
    • VBA
    • Excel Tips and Tricks
    • Excel Dashboards
    • Power Pivot & DAX
  • Power BI
  • Template Store
    • Ready to Use Templates
  • Courses
  • Academy
    • Excel + AI Mastery: 100 Formulas
    • Excel Pivot Tables & Dashboards
  • About Us
  • Contact Us

PK: An Excel Expert

Transforming Data into Decisions

Tag: Region Performance Dashboard

Dashboard Power BI

Renewable Infrastructure Projects Dashboard in Power BI

February 17, 2026February 17, 2026 PKComments Off on Renewable Infrastructure Projects Dashboard in Power BI
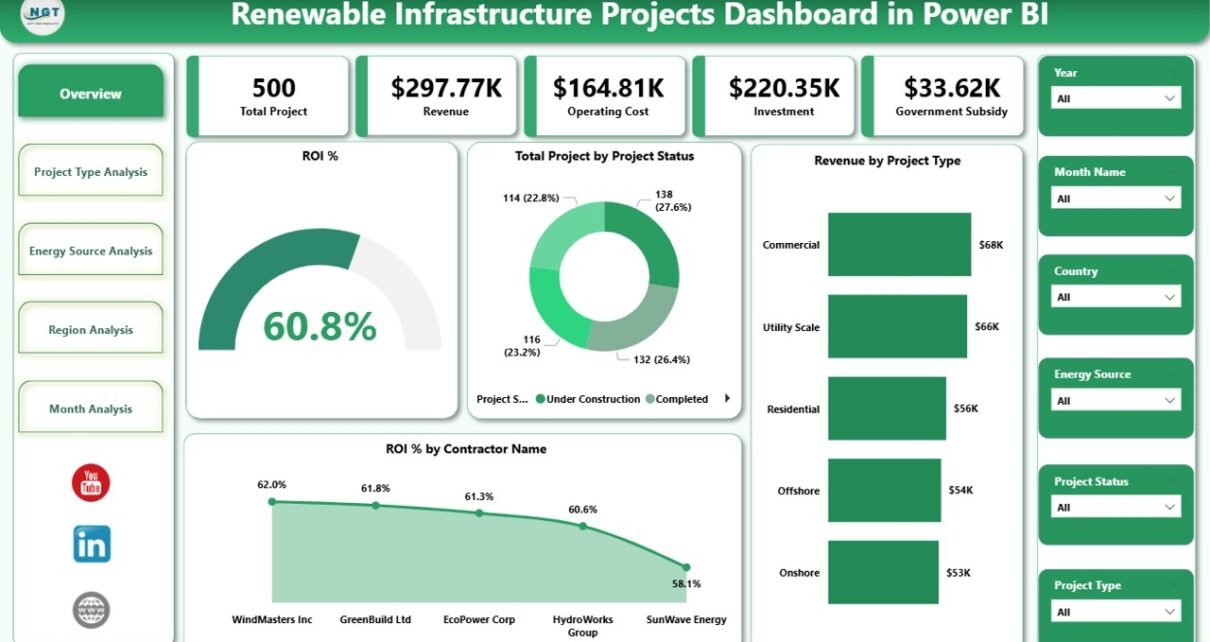
In today’s fast-changing energy world, renewable infrastructure projects continue to grow rapidly. Governments invest heavily. Private investors fund large solar and wind farms. Meanwhile, project managers handle multiple contracts, regions,
Read More
Dashboard

Road and Highway Construction Dashboard in Excel

February 16, 2026February 16, 2026 PKComments Off on Road and Highway Construction Dashboard in Excel
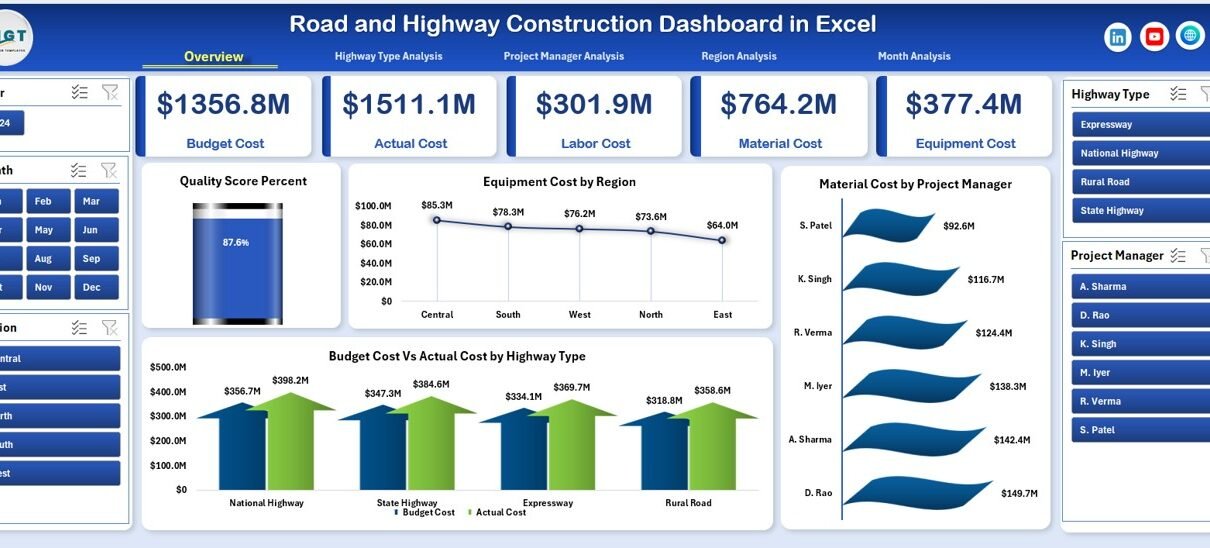
Road and highway construction projects demand strict monitoring. Budgets run into millions. Deadlines stay tight. Quality standards remain non-negotiable. Therefore, project leaders must track every cost element, performance indicator, and
Read More
Dashboard

Digital Transformation Dashboard in Excel

February 11, 2026February 11, 2026 PKComments Off on Digital Transformation Dashboard in Excel
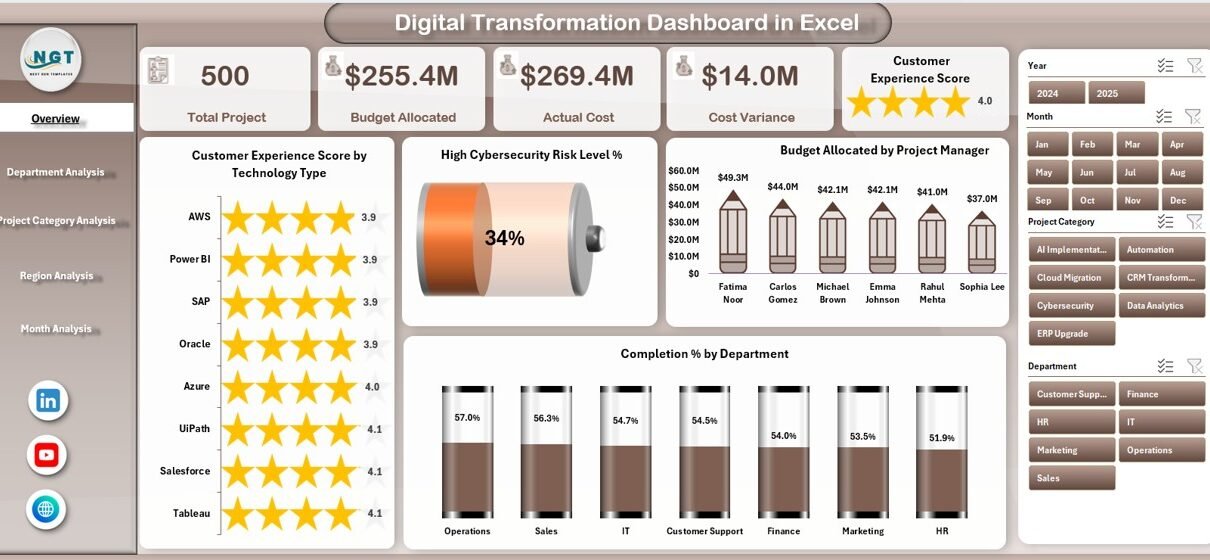
This ready-to-use dashboard gives leaders complete visibility into transformation projects. Moreover, it converts raw data into clear, interactive insights. As a result, decision-makers can track performance, control budgets, and improve
Read More
Dashboard

Footwear & Accessories Dashboard in Excel

November 17, 2025November 17, 2025 PKComments Off on Footwear & Accessories Dashboard in Excel
Retail brands in the footwear and accessories industry deal with fast-changing trends, daily sales fluctuations, customer expectations, and tight margins. Because of this constant movement, retailers need a simple and
Read More
  • Learn Excel (Free Course)
    • 1. Shortcut Keys
    • 2. Fill & Flash Fill
    • 3. Find & Replace
    • 4. Sort & Filter
    • 5. Formulas & Functions
    • 6. Data Validation
    • 7. Conditional Formatting
    • 8. Basic Charts
    • 9. Advanced Charts
    • 10. Pivot Tables
    • 11. Excel Dashboards
    • 12. VBA Course
    • 13. Excel Formulas with AI
  • Templates
  • Tutorials
    • Charts and Visualization
    • VBA
    • Excel Tips and Tricks
    • Excel Dashboards
    • Power Pivot & DAX
  • Power BI
  • Template Store
    • Ready to Use Templates
  • Courses
  • Academy
    • Excel + AI Mastery: 100 Formulas
    • Excel Pivot Tables & Dashboards
  • About Us
  • Contact Us
Copyright © 2023 PK-AnExcelExpert.com - Privacy Policy