New: NextGenTemplates Academy - video courses on Excel formulas with AI and Pivot Tables & dashboards. Early-bird: 20% off with code EARLYBIRD20 - first 20 orders only. See the courses →
  • Learn Excel (Free Course)
    • 1. Shortcut Keys
    • 2. Fill & Flash Fill
    • 3. Find & Replace
    • 4. Sort & Filter
    • 5. Formulas & Functions
    • 6. Data Validation
    • 7. Conditional Formatting
    • 8. Basic Charts
    • 9. Advanced Charts
    • 10. Pivot Tables
    • 11. Excel Dashboards
    • 12. VBA Course
    • 13. Excel Formulas with AI
  • Templates
  • Tutorials
    • Charts and Visualization
    • VBA
    • Excel Tips and Tricks
    • Excel Dashboards
    • Power Pivot & DAX
  • Power BI
  • Template Store
    • Ready to Use Templates
  • Courses
  • Academy
    • Excel + AI Mastery: 100 Formulas
    • Excel Pivot Tables & Dashboards
  • About Us
  • Contact Us

PK: An Excel Expert

Transforming Data into Decisions

Tag: Research Metrics

Dashboard Power BI

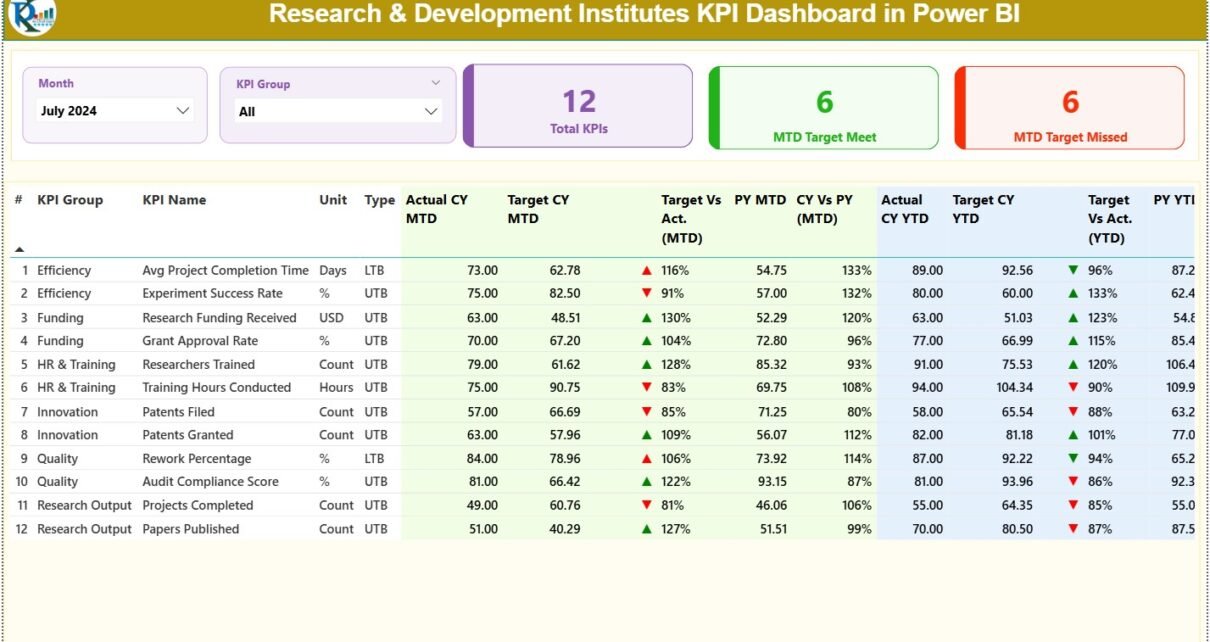
Research & Development Institutes KPI Dashboard in Power BI

December 11, 2025December 11, 2025 PKComments Off on Research & Development Institutes KPI Dashboard in Power BI
Research and Development (R&D) institutes run innovation, discovery, science, and technology growth. These institutes handle complex projects, long development cycles, advanced experiments, and multi-disciplinary teams. Because of this, leaders need
Read More
Dashboard

Research & Development Institutes KPI Dashboard in Excel

November 29, 2025November 29, 2025 PKComments Off on Research & Development Institutes KPI Dashboard in Excel
Research and Development (R&D) plays a key role in innovation, scientific growth, and industry advancement. However, research institutes often struggle to measure their performance clearly. Teams manage several projects, experiments,
Read More
Dashboard

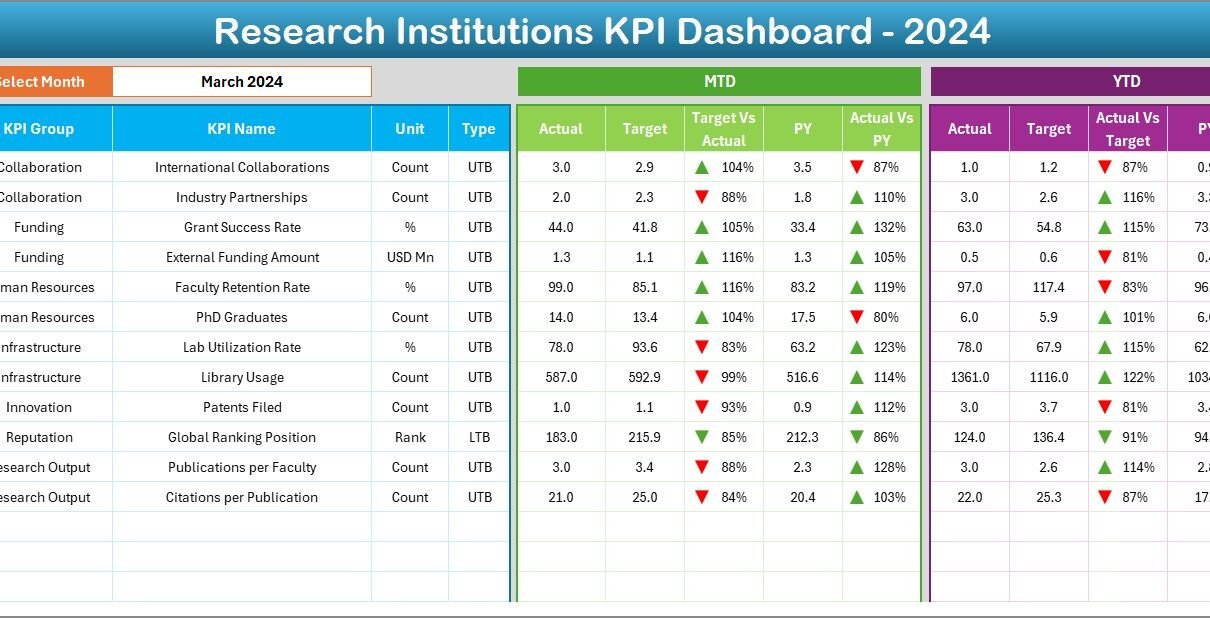
Research Institutions KPI Dashboard in Excel

September 18, 2025September 18, 2025 PKComments Off on Research Institutions KPI Dashboard in Excel
Research institutions thrive on innovation, discovery, and collaboration. Yet, without proper performance measurement, even the most promising projects can lose direction. Monitoring the right Key Performance Indicators (KPIs) ensures that
Read More
Dashboard

Scientific Research KPI Dashboard in Excel

January 22, 2025March 21, 2025 PKComments Off on Scientific Research KPI Dashboard in Excel
Scientific research is the cornerstone of innovation and progress in various fields. Institutions, universities, and research organizations invest significant time and resources into advancing knowledge, solving problems, and creating new
Read More
Dashboard

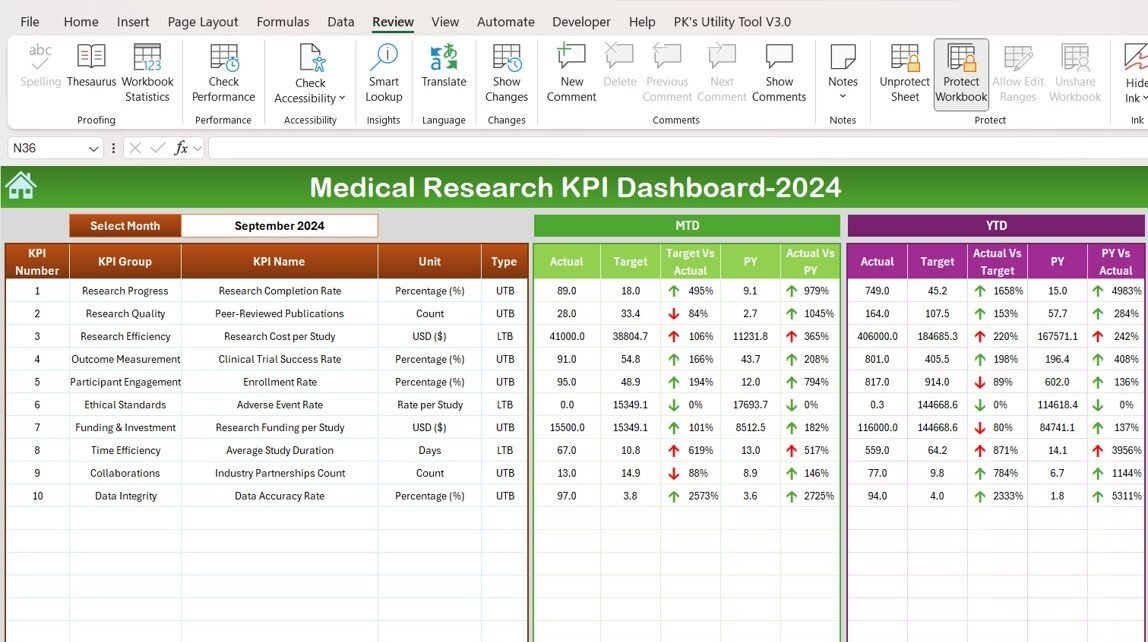
Medical Research KPI Dashboard in Excel

January 19, 2025March 24, 2025 PKComments Off on Medical Research KPI Dashboard in Excel
In the fast-paced world of medical research, tracking performance through precise Key Performance Indicators (KPIs) is essential. The Medical Research KPI Dashboard serves as a centralized tool for monitoring the
Read More
  • Learn Excel (Free Course)
    • 1. Shortcut Keys
    • 2. Fill & Flash Fill
    • 3. Find & Replace
    • 4. Sort & Filter
    • 5. Formulas & Functions
    • 6. Data Validation
    • 7. Conditional Formatting
    • 8. Basic Charts
    • 9. Advanced Charts
    • 10. Pivot Tables
    • 11. Excel Dashboards
    • 12. VBA Course
    • 13. Excel Formulas with AI
  • Templates
  • Tutorials
    • Charts and Visualization
    • VBA
    • Excel Tips and Tricks
    • Excel Dashboards
    • Power Pivot & DAX
  • Power BI
  • Template Store
    • Ready to Use Templates
  • Courses
  • Academy
    • Excel + AI Mastery: 100 Formulas
    • Excel Pivot Tables & Dashboards
  • About Us
  • Contact Us
Copyright © 2023 PK-AnExcelExpert.com - Privacy Policy