New: NextGenTemplates Academy - video courses on Excel formulas with AI and Pivot Tables & dashboards. Early-bird: 20% off with code EARLYBIRD20 - first 20 orders only. See the courses →
  • Learn Excel (Free Course)
    • 1. Shortcut Keys
    • 2. Fill & Flash Fill
    • 3. Find & Replace
    • 4. Sort & Filter
    • 5. Formulas & Functions
    • 6. Data Validation
    • 7. Conditional Formatting
    • 8. Basic Charts
    • 9. Advanced Charts
    • 10. Pivot Tables
    • 11. Excel Dashboards
    • 12. VBA Course
    • 13. Excel Formulas with AI
  • Templates
  • Tutorials
    • Charts and Visualization
    • VBA
    • Excel Tips and Tricks
    • Excel Dashboards
    • Power Pivot & DAX
  • Power BI
  • Template Store
    • Ready to Use Templates
  • Courses
  • Academy
    • Excel + AI Mastery: 100 Formulas
    • Excel Pivot Tables & Dashboards
  • About Us
  • Contact Us

PK: An Excel Expert

Transforming Data into Decisions
Tag: Retail Dashboard

Dashboard Power BI

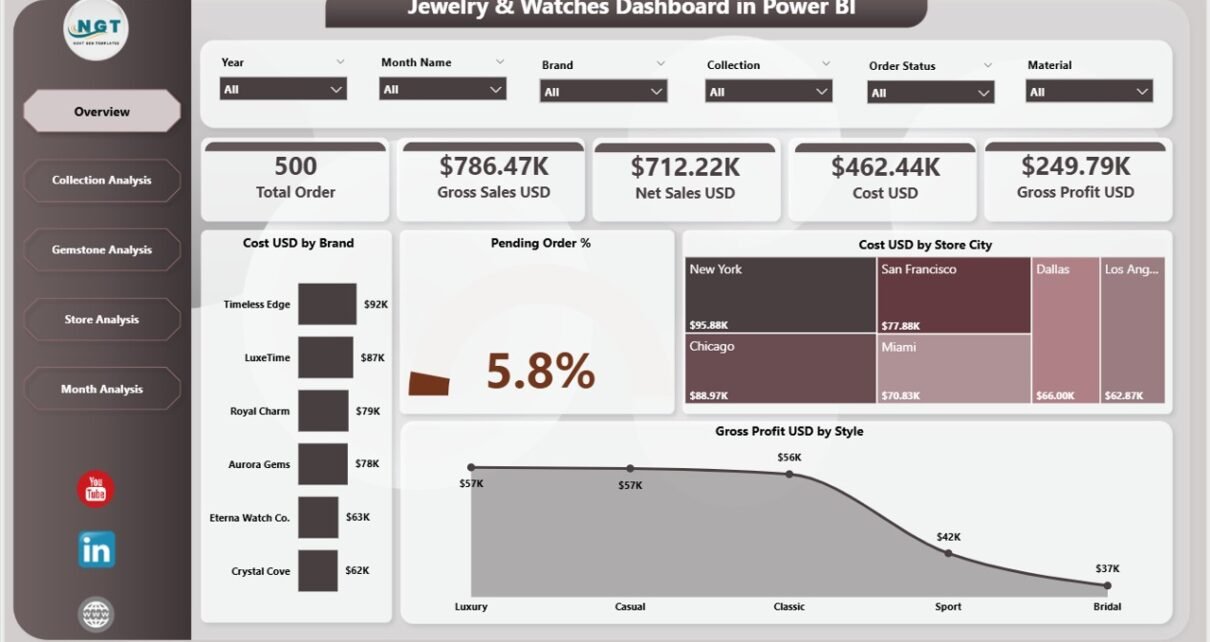
Jewellery & Watches Dashboard in Power BI

November 29, 2025November 29, 2025 PKComments Off on Jewellery & Watches Dashboard in Power BI
The jewellery and watches industry runs on precision, trust, and refined customer experience. Because of this, businesses in this sector depend on meaningful data that helps them understand sales patterns,
Read More
Dashboard

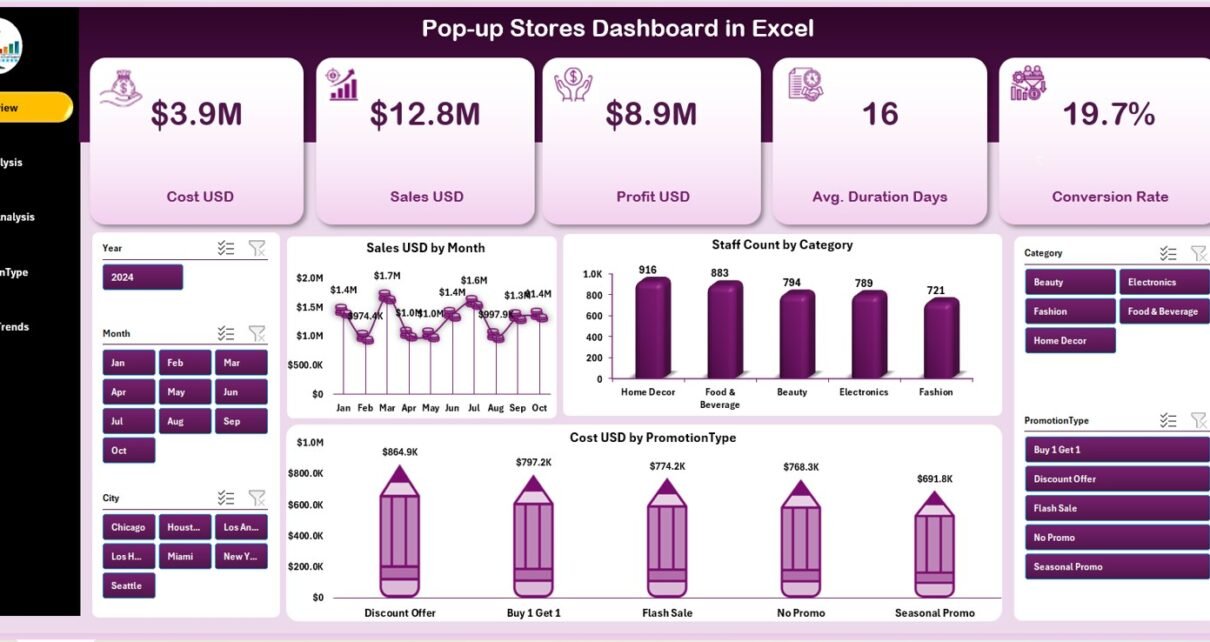
Pop-up Stores Dashboard in Excel

November 20, 2025November 20, 2025 PKComments Off on Pop-up Stores Dashboard in Excel
Pop-up stores are one of the fastest-growing retail trends today. Brands use them to test new markets, launch products, create customer experiences, and generate quick revenue without long-term store commitments.
Read More
Dashboard

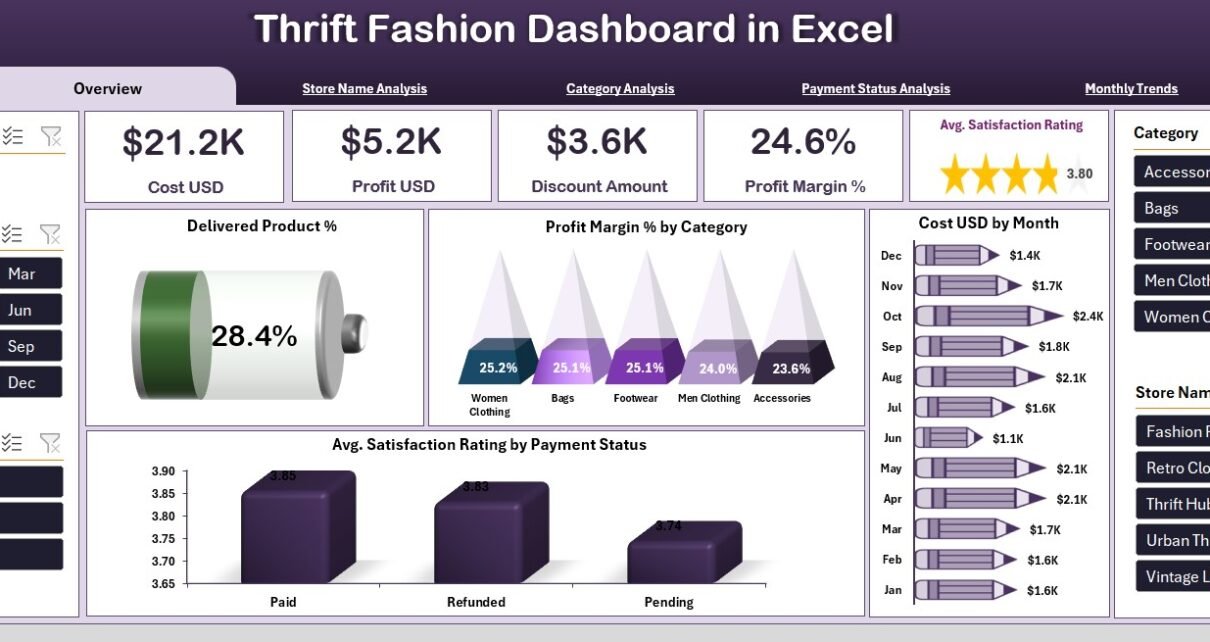
Thrift Fashion Dashboard in Excel

November 18, 2025November 18, 2025 PKComments Off on Thrift Fashion Dashboard in Excel
The thrift fashion industry grows rapidly because consumers want sustainable, budget-friendly, and unique fashion choices. Store owners must track sales, categories, product returns, customer satisfaction, and store-wise performance to stay
Read More
Dashboard

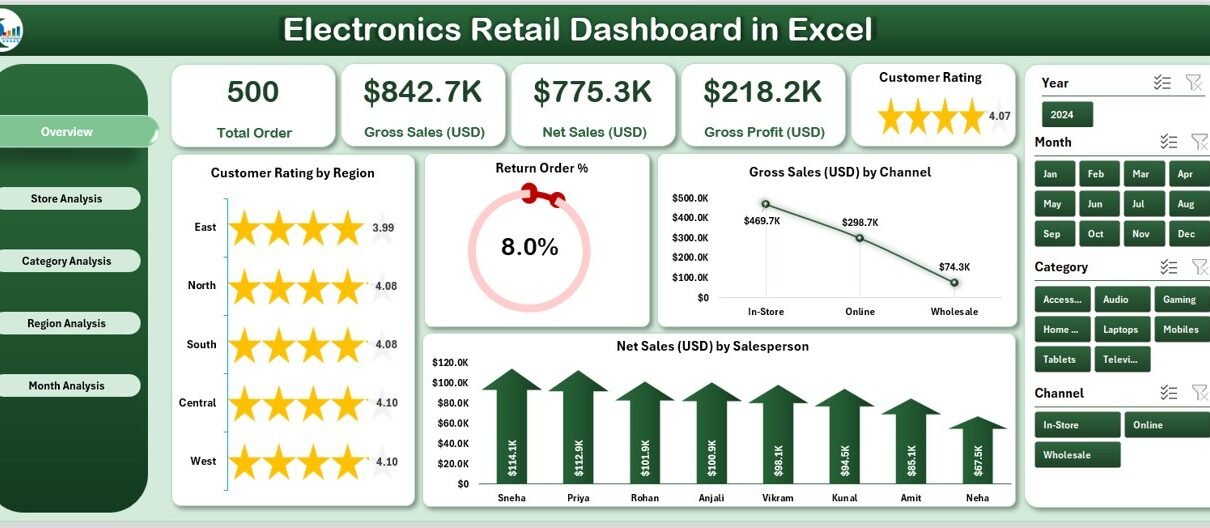
Electronics Retail Dashboard in Excel

November 17, 2025November 17, 2025 PKComments Off on Electronics Retail Dashboard in Excel
The electronics retail industry moves fast. Prices shift daily, customer preferences change quickly, and sales trends vary across stores, categories, and regions. Because of this constant change, business owners need
Read More
Dashboard

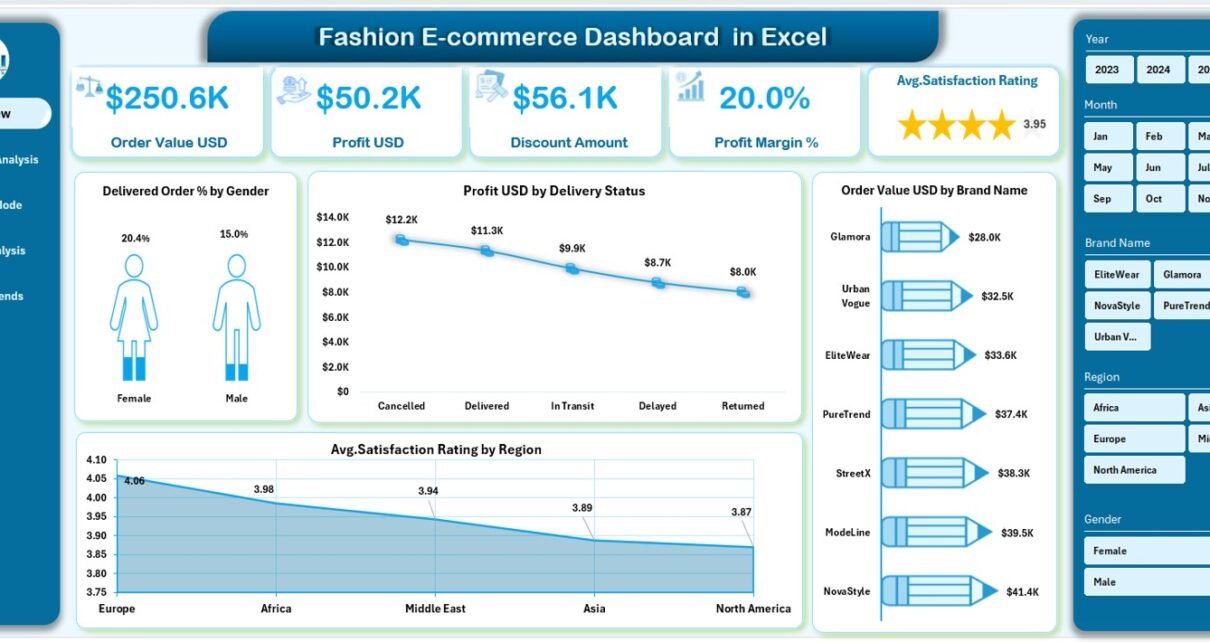
Fashion E-commerce Dashboard in Excel

November 11, 2025November 11, 2025 PKComments Off on Fashion E-commerce Dashboard in Excel
In the fast-moving world of online fashion retail, every sale, discount, and return provides valuable insight into customer behavior and business performance. However, managing these data points manually can become
Read More
Templates

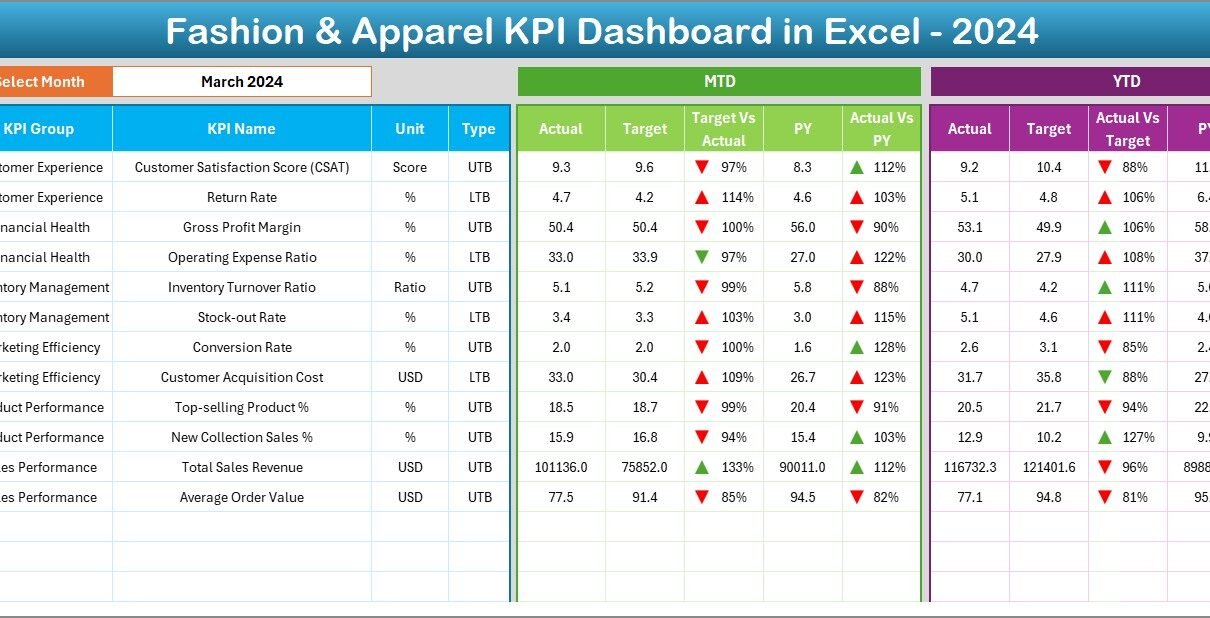
Fashion & Apparel KPI Dashboard in Excel

November 5, 2025November 5, 2025 PKComments Off on Fashion & Apparel KPI Dashboard in Excel
In today’s fast-moving fashion world, data is the new trendsetter. Every brand — from global labels to boutique designers — needs accurate, real-time insights into their sales, stock, designs, and
Read More
Dashboard

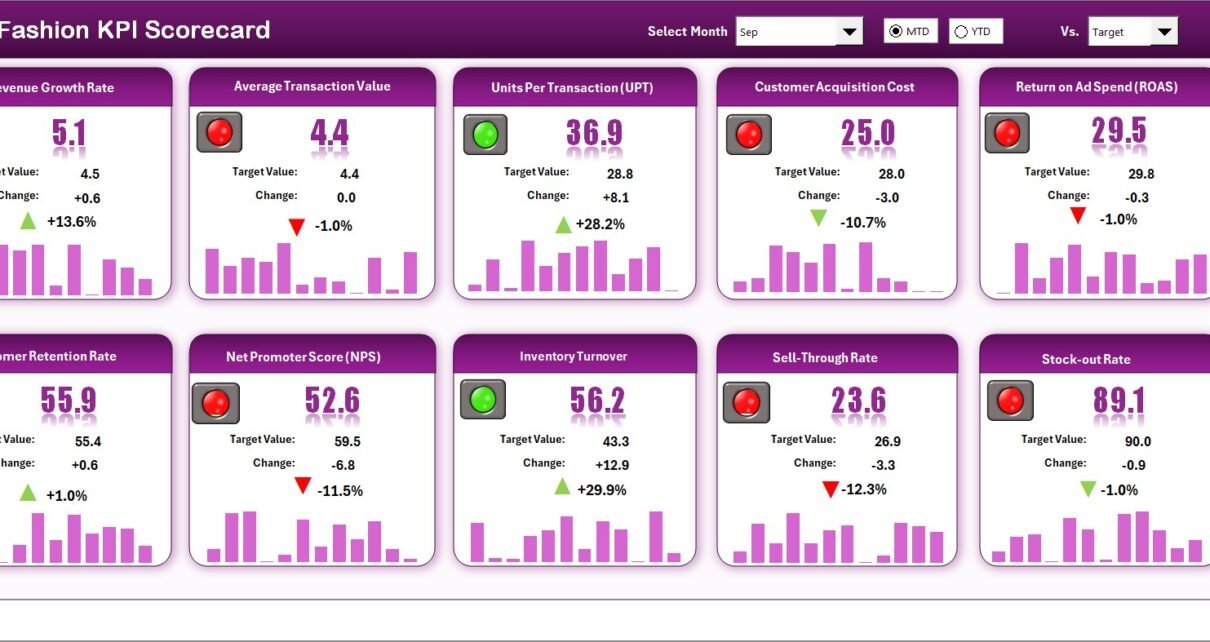
Fashion KPI Scorecard in Excel

October 8, 2025October 8, 2025 PKComments Off on Fashion KPI Scorecard in Excel
The fashion industry runs on creativity, speed, and data. Every design, production run, and retail sale reflects a series of decisions that determine profitability and brand success. To manage this
Read More
Dashboard

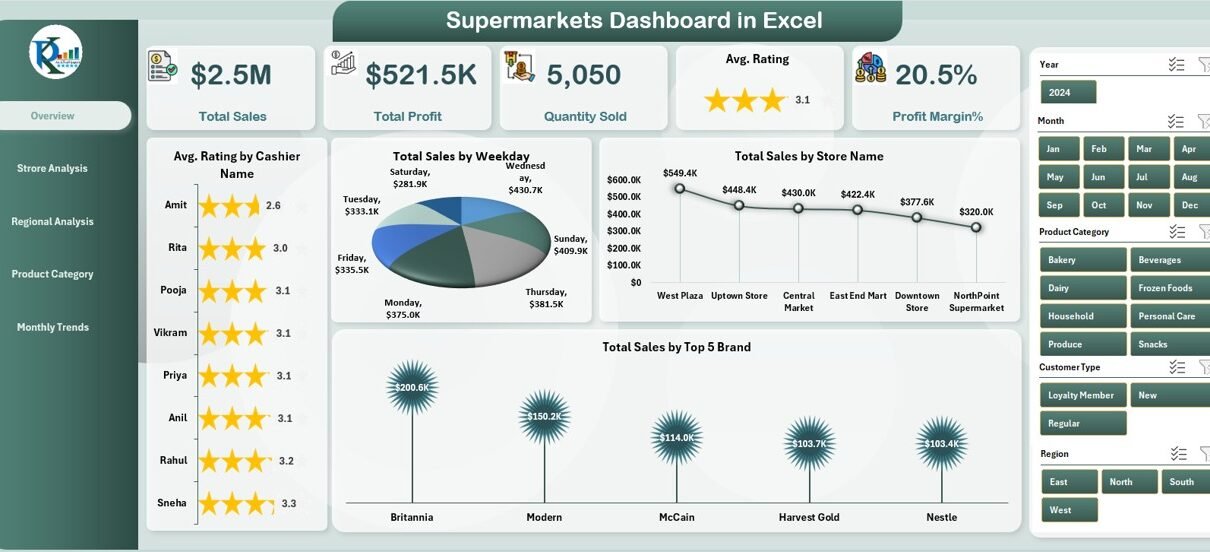
Supermarkets Dashboard in Excel

October 7, 2025October 14, 2025 PKComments Off on Supermarkets Dashboard in Excel
In today’s fast-paced retail world, supermarkets deal with huge volumes of data every single day — from sales transactions and product returns to customer feedback and inventory levels. Managing this
Read More
Dashboard Power BI

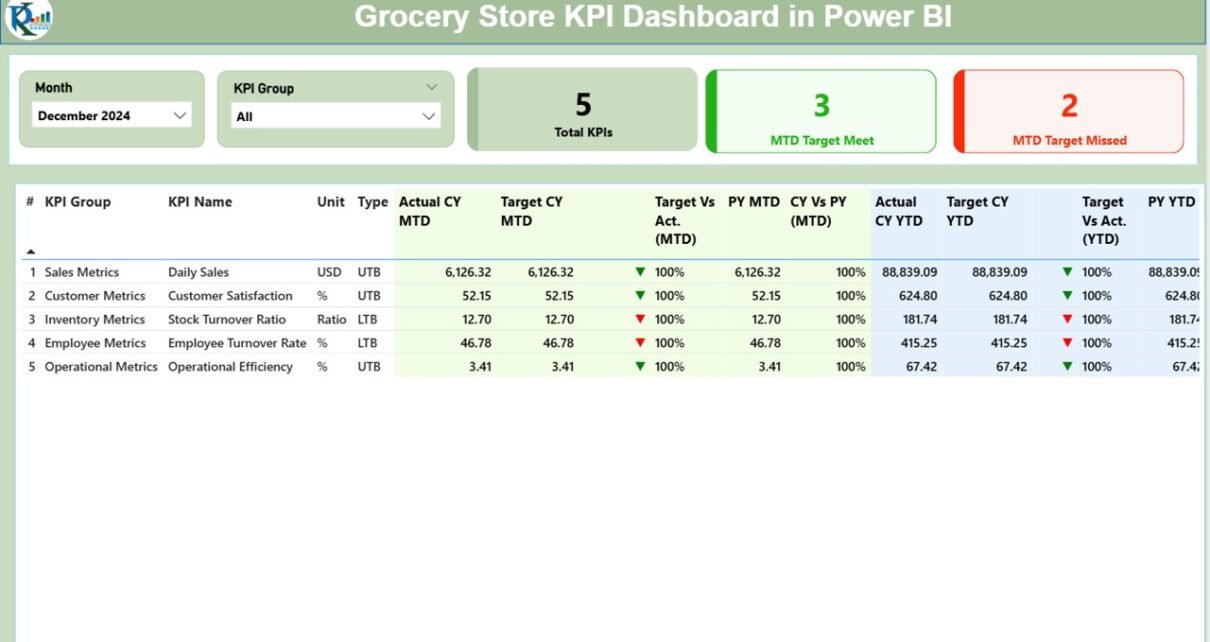
Grocery Store KPI Dashboard in Power BI

September 9, 2025September 9, 2025 PKComments Off on Grocery Store KPI Dashboard in Power BI
Running a grocery store is not just about stocking shelves and serving customers. Behind the scenes, a lot of data drives profitability, customer satisfaction, and operational efficiency. From monitoring sales
Read More
Power BI

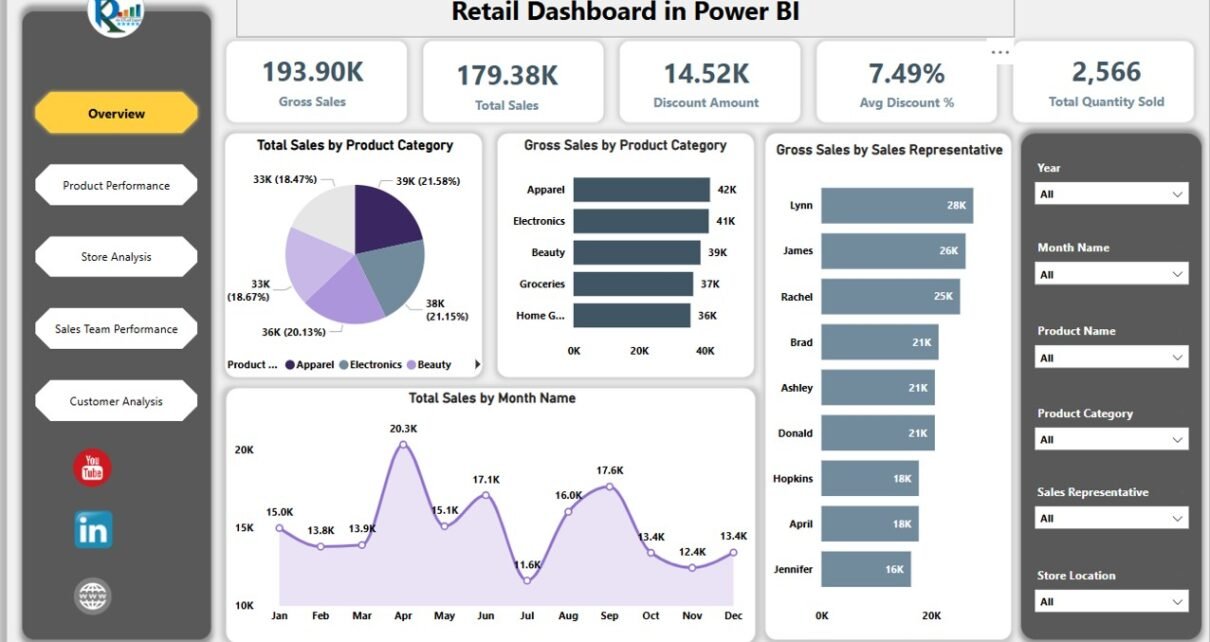
Retail Dashboard in Power BI

June 20, 2025June 20, 2025 PKComments Off on Retail Dashboard in Power BI
In the retail industry, having a clear overview of sales, inventory, and performance metrics is essential for making informed decisions and driving business growth. The Retail Dashboard in Power BI
Read More

Posts pagination

Previous 1 2 3 Next
  • Learn Excel (Free Course)
    • 1. Shortcut Keys
    • 2. Fill & Flash Fill
    • 3. Find & Replace
    • 4. Sort & Filter
    • 5. Formulas & Functions
    • 6. Data Validation
    • 7. Conditional Formatting
    • 8. Basic Charts
    • 9. Advanced Charts
    • 10. Pivot Tables
    • 11. Excel Dashboards
    • 12. VBA Course
    • 13. Excel Formulas with AI
  • Templates
  • Tutorials
    • Charts and Visualization
    • VBA
    • Excel Tips and Tricks
    • Excel Dashboards
    • Power Pivot & DAX
  • Power BI
  • Template Store
    • Ready to Use Templates
  • Courses
  • Academy
    • Excel + AI Mastery: 100 Formulas
    • Excel Pivot Tables & Dashboards
  • About Us
  • Contact Us
Copyright © 2023 PK-AnExcelExpert.com - Privacy Policy