New: NextGenTemplates Academy - video courses on Excel formulas with AI and Pivot Tables & dashboards. Early-bird: 20% off with code EARLYBIRD20 - first 20 orders only. See the courses →
  • Learn Excel (Free Course)
    • 1. Shortcut Keys
    • 2. Fill & Flash Fill
    • 3. Find & Replace
    • 4. Sort & Filter
    • 5. Formulas & Functions
    • 6. Data Validation
    • 7. Conditional Formatting
    • 8. Basic Charts
    • 9. Advanced Charts
    • 10. Pivot Tables
    • 11. Excel Dashboards
    • 12. VBA Course
    • 13. Excel Formulas with AI
  • Templates
  • Tutorials
    • Charts and Visualization
    • VBA
    • Excel Tips and Tricks
    • Excel Dashboards
    • Power Pivot & DAX
  • Power BI
  • Template Store
    • Ready to Use Templates
  • Courses
  • Academy
    • Excel + AI Mastery: 100 Formulas
    • Excel Pivot Tables & Dashboards
  • About Us
  • Contact Us

PK: An Excel Expert

Transforming Data into Decisions

Tag: Retail KPI Dashboard

Dashboard

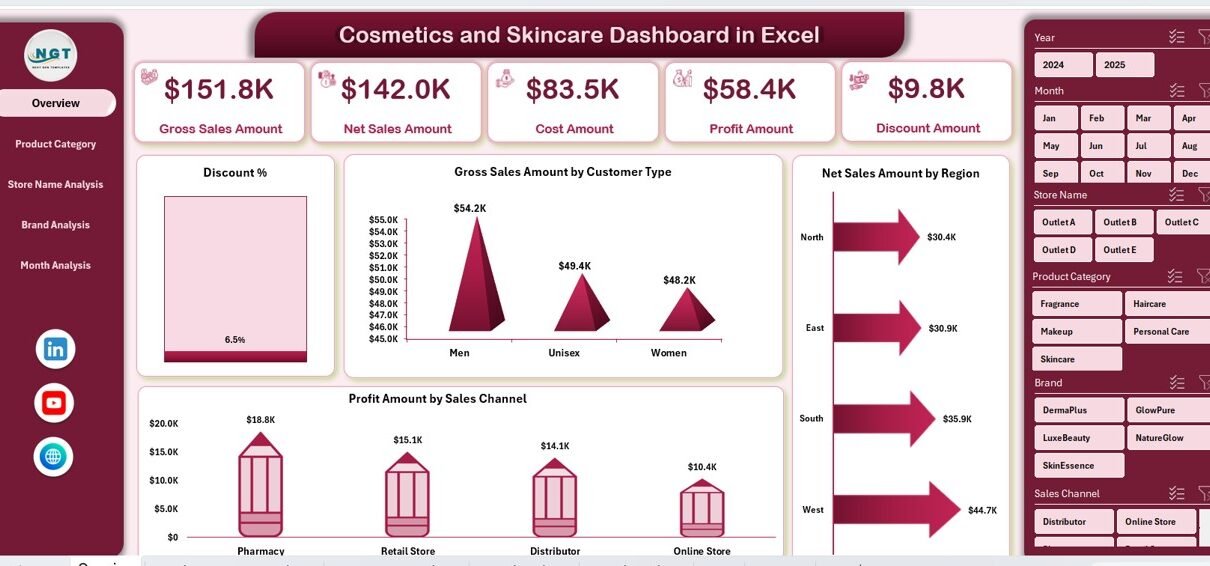
Cosmetics and Skincare Dashboard in Excel

January 29, 2026January 29, 2026 PKComments Off on Cosmetics and Skincare Dashboard in Excel
The cosmetics and skincare industry grows rapidly every year. New brands enter the market, customer preferences change quickly, and competition increases constantly. Therefore, businesses must track sales, profit, discounts, brands,
Read More
Dashboard Power BI

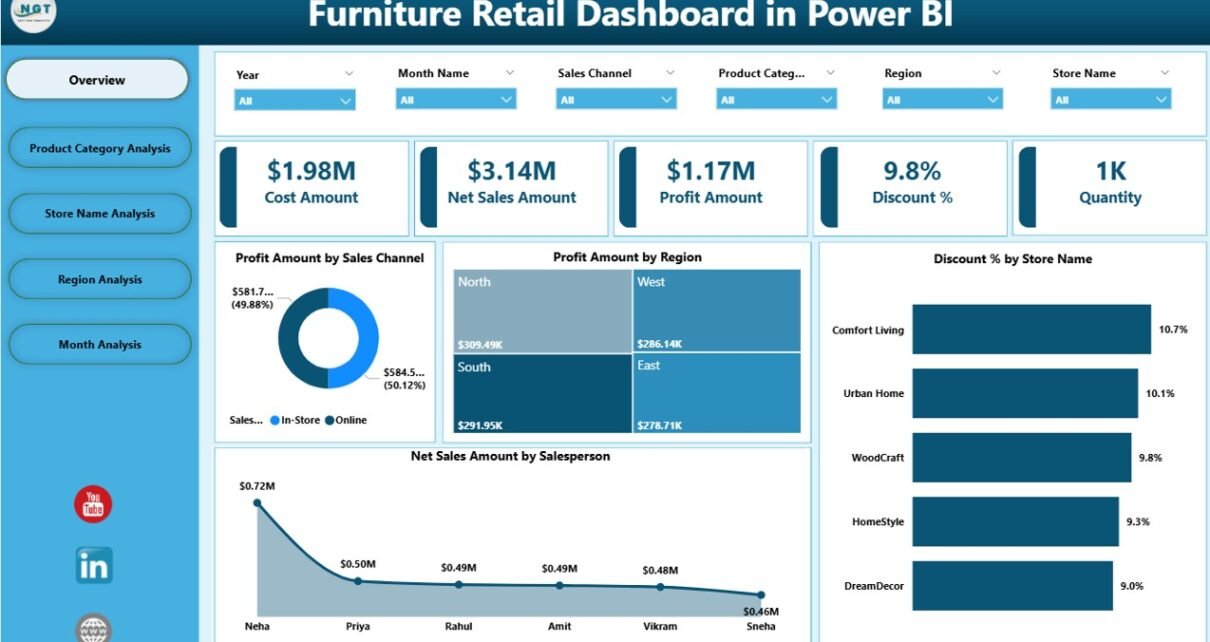
Furniture Retail Dashboard in Power BI

January 28, 2026January 28, 2026 PKComments Off on Furniture Retail Dashboard in Power BI
Furniture retail is a competitive and data-driven business. Every day, retailers track sales, discounts, profits, stores, regions, and product categories. However, when this data sits in multiple files or static
Read More
Dashboard

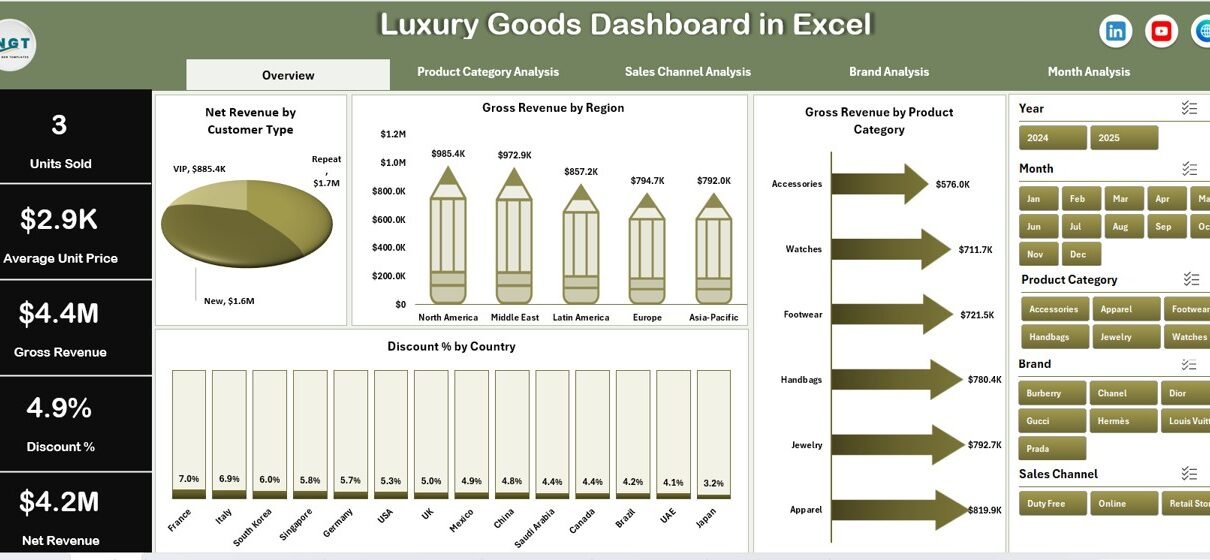
Luxury Goods Dashboard in Excel

January 28, 2026January 28, 2026 PKComments Off on Luxury Goods Dashboard in Excel
Luxury brands operate in a world where precision, exclusivity, and performance matter deeply. While aesthetics define luxury, data defines success. However, many luxury businesses still rely on scattered spreadsheets, manual
Read More
Dashboard Power BI

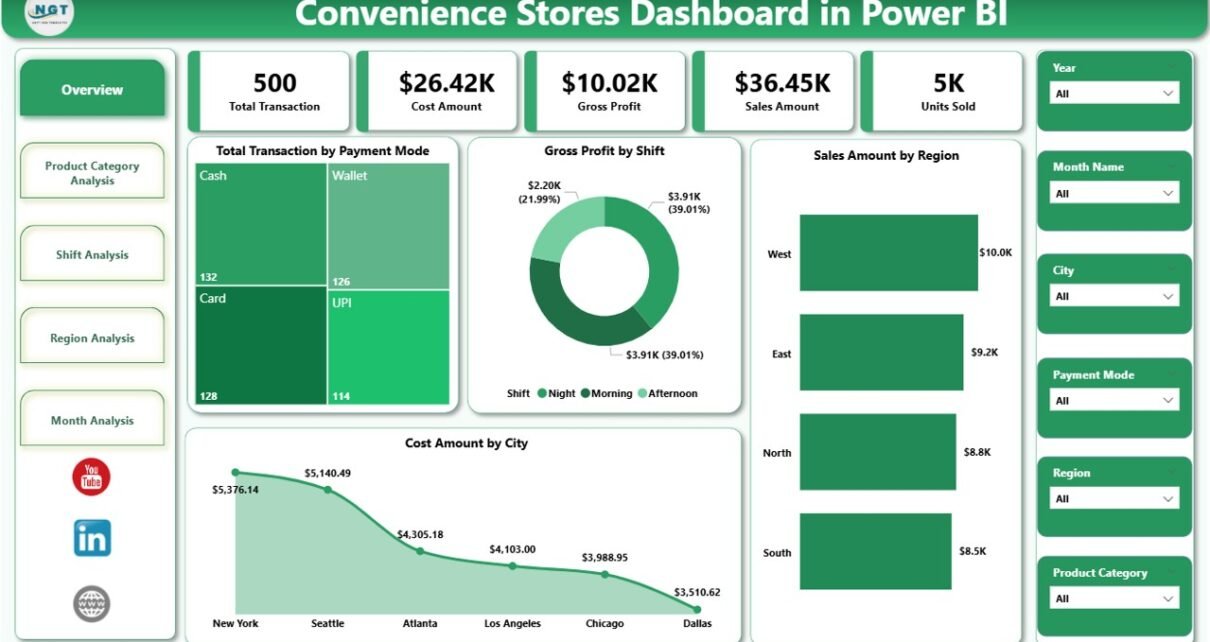
Convenience Stores Dashboard in Power BI

January 28, 2026January 28, 2026 PKComments Off on Convenience Stores Dashboard in Power BI
Running a convenience store looks simple from the outside. However, in reality, it involves managing thousands of transactions, multiple product categories, different shifts, varied payment modes, and regional performance differences—every
Read More
Dashboard

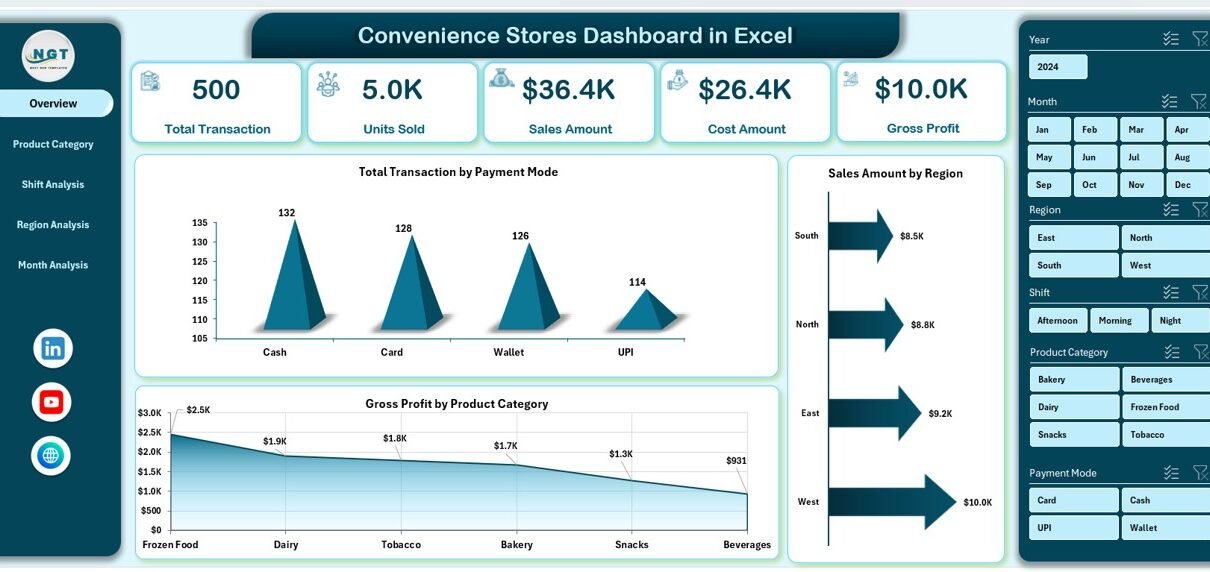
Convenience Stores Dashboard in Excel

January 26, 2026January 26, 2026 PKComments Off on Convenience Stores Dashboard in Excel
Managing a convenience store involves fast decisions, thin margins, and constant monitoring. However, many store owners and managers still depend on scattered Excel files, daily sales registers, and manual reports.
Read More
Dashboard

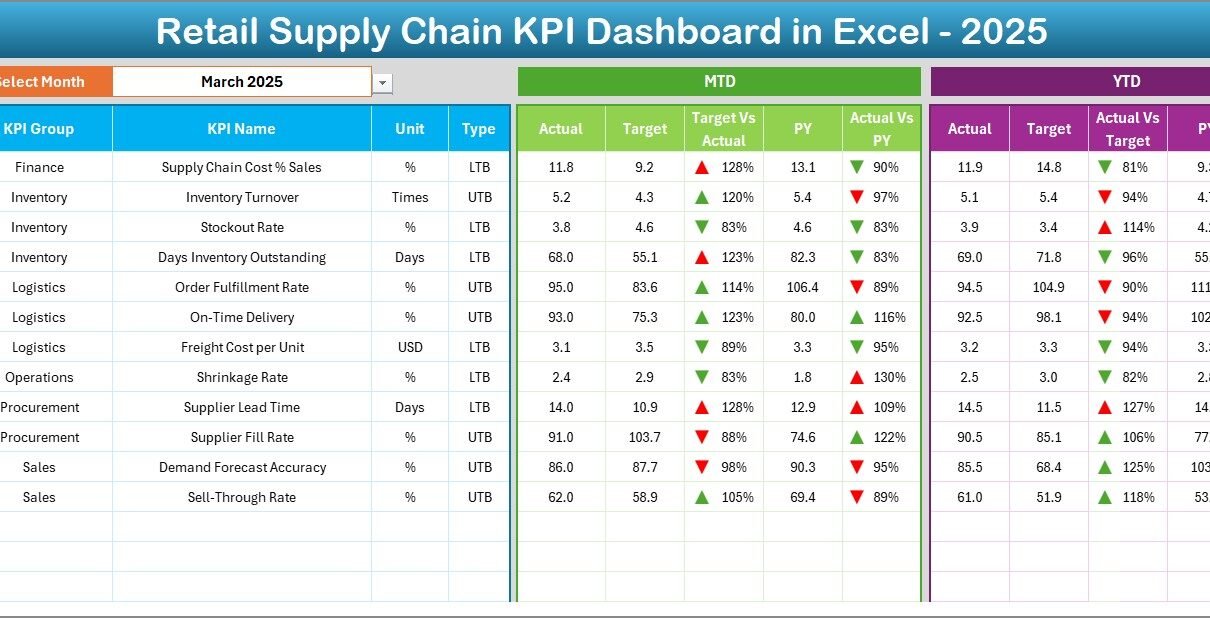
Retail Supply Chain KPI Dashboard in Excel

January 13, 2026January 13, 2026 PKComments Off on Retail Supply Chain KPI Dashboard in Excel
Managing a retail supply chain without clear visibility always creates delays, cost overruns, and poor customer experiences. Retail organizations handle procurement, inventory, logistics, warehousing, and store replenishment daily. Therefore, tracking
Read More
Dashboard Power BI

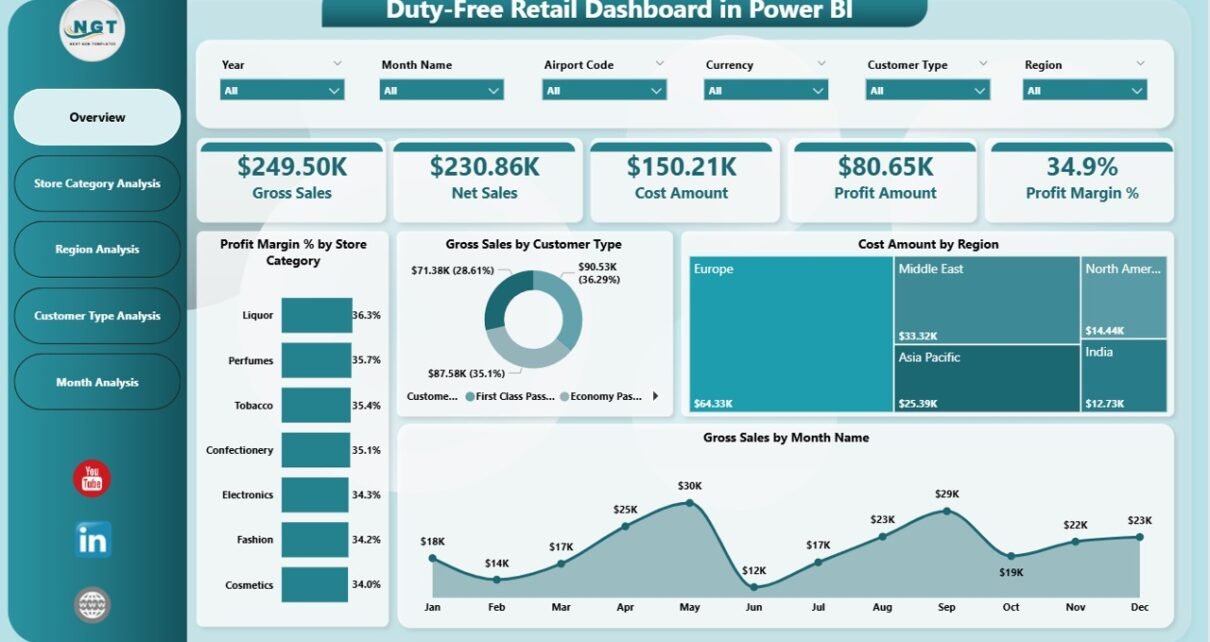
Duty-Free Retail Dashboard in Power BI

January 12, 2026January 12, 2026 PKComments Off on Duty-Free Retail Dashboard in Power BI
Managing duty-free retail operations requires speed, accuracy, and clear insights. However, many duty-free retailers still depend on multiple Excel files, manual reports, and delayed summaries. As a result, decision-makers struggle
Read More
Dashboard Power BI

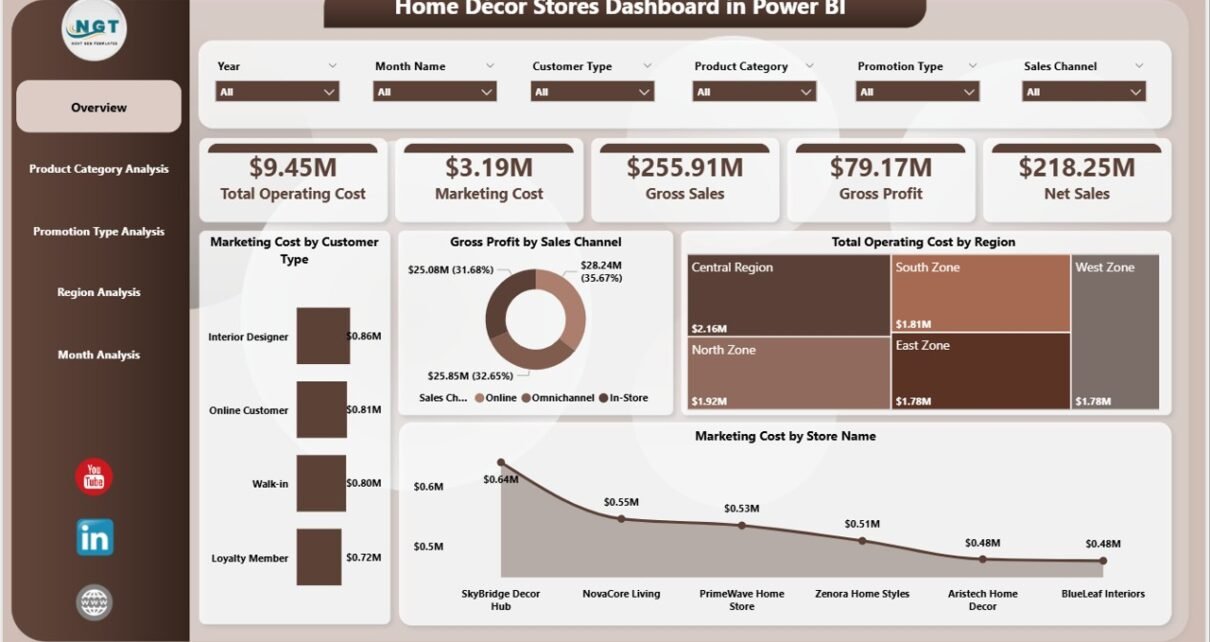
Home Décor Stores Dashboard in Power BI

January 9, 2026January 9, 2026 PKComments Off on Home Décor Stores Dashboard in Power BI
Home décor retail has become highly competitive. Customers expect trendy products, seamless experiences, and attractive pricing. At the same time, store owners must control costs, manage promotions, and improve profitability.
Read More
Dashboard Power BI

Department Stores Dashboard in Power BI

January 8, 2026January 8, 2026 PKComments Off on Department Stores Dashboard in Power BI
Department stores operate in a highly competitive and data-driven environment. Every day, they generate massive amounts of data related to sales, customers, promotions, departments, and operating costs. However, without a
Read More
Dashboard

Thrift Stores KPI Dashboard in Excel

January 3, 2026January 3, 2026 PKComments Off on Thrift Stores KPI Dashboard in Excel
Running a thrift store requires more than passion and good inventory. You need clarity, control, and continuous performance tracking. However, many thrift store owners and managers still rely on scattered
Read More

Posts pagination

Previous 1 2 3 … 5 Next
  • Learn Excel (Free Course)
    • 1. Shortcut Keys
    • 2. Fill & Flash Fill
    • 3. Find & Replace
    • 4. Sort & Filter
    • 5. Formulas & Functions
    • 6. Data Validation
    • 7. Conditional Formatting
    • 8. Basic Charts
    • 9. Advanced Charts
    • 10. Pivot Tables
    • 11. Excel Dashboards
    • 12. VBA Course
    • 13. Excel Formulas with AI
  • Templates
  • Tutorials
    • Charts and Visualization
    • VBA
    • Excel Tips and Tricks
    • Excel Dashboards
    • Power Pivot & DAX
  • Power BI
  • Template Store
    • Ready to Use Templates
  • Courses
  • Academy
    • Excel + AI Mastery: 100 Formulas
    • Excel Pivot Tables & Dashboards
  • About Us
  • Contact Us
Copyright © 2023 PK-AnExcelExpert.com - Privacy Policy