New: NextGenTemplates Academy - video courses on Excel formulas with AI and Pivot Tables & dashboards. Early-bird: 20% off with code EARLYBIRD20 - first 20 orders only. See the courses →
  • Learn Excel (Free Course)
    • 1. Shortcut Keys
    • 2. Fill & Flash Fill
    • 3. Find & Replace
    • 4. Sort & Filter
    • 5. Formulas & Functions
    • 6. Data Validation
    • 7. Conditional Formatting
    • 8. Basic Charts
    • 9. Advanced Charts
    • 10. Pivot Tables
    • 11. Excel Dashboards
    • 12. VBA Course
    • 13. Excel Formulas with AI
  • Templates
  • Tutorials
    • Charts and Visualization
    • VBA
    • Excel Tips and Tricks
    • Excel Dashboards
    • Power Pivot & DAX
  • Power BI
  • Template Store
    • Ready to Use Templates
  • Courses
  • Academy
    • Excel + AI Mastery: 100 Formulas
    • Excel Pivot Tables & Dashboards
  • About Us
  • Contact Us

PK: An Excel Expert

Transforming Data into Decisions

Tag: Revenue Analysis Excel

Dashboard

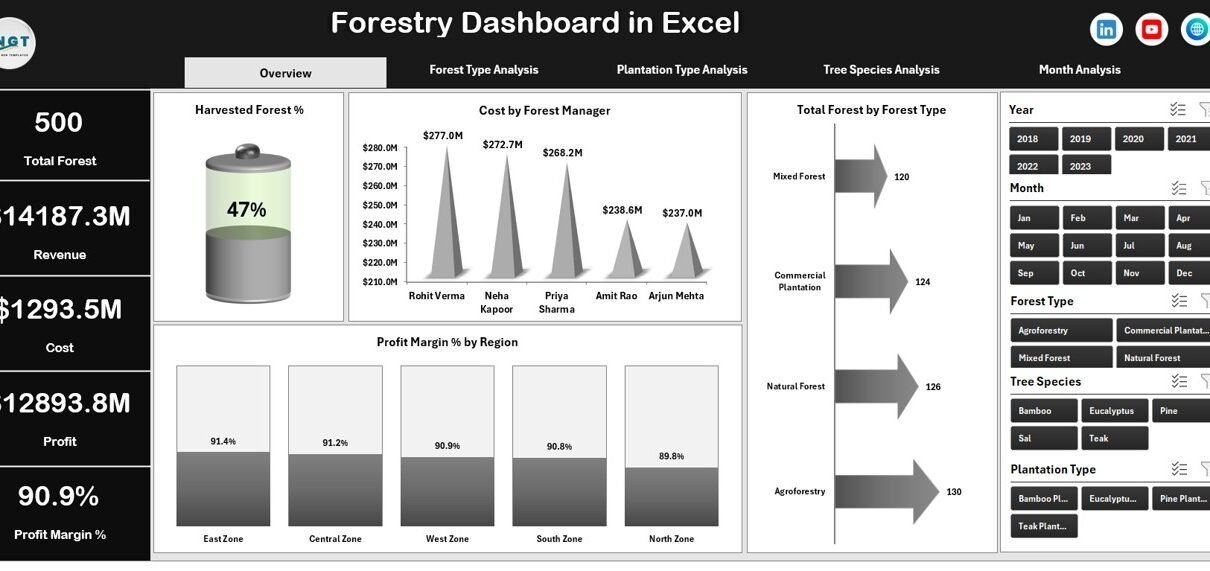
Forestry Dashboard in Excel

February 7, 2026February 7, 2026 PKComments Off on Forestry Dashboard in Excel
Forestry operations require strong planning, clear visibility, and continuous monitoring. However, many forestry businesses still depend on scattered spreadsheets. As a result, managers struggle to track harvesting performance, revenue, cost,
Read More
Dashboard

Influencer Marketing Dashboard in Excel

February 6, 2026February 6, 2026 PKComments Off on Influencer Marketing Dashboard in Excel
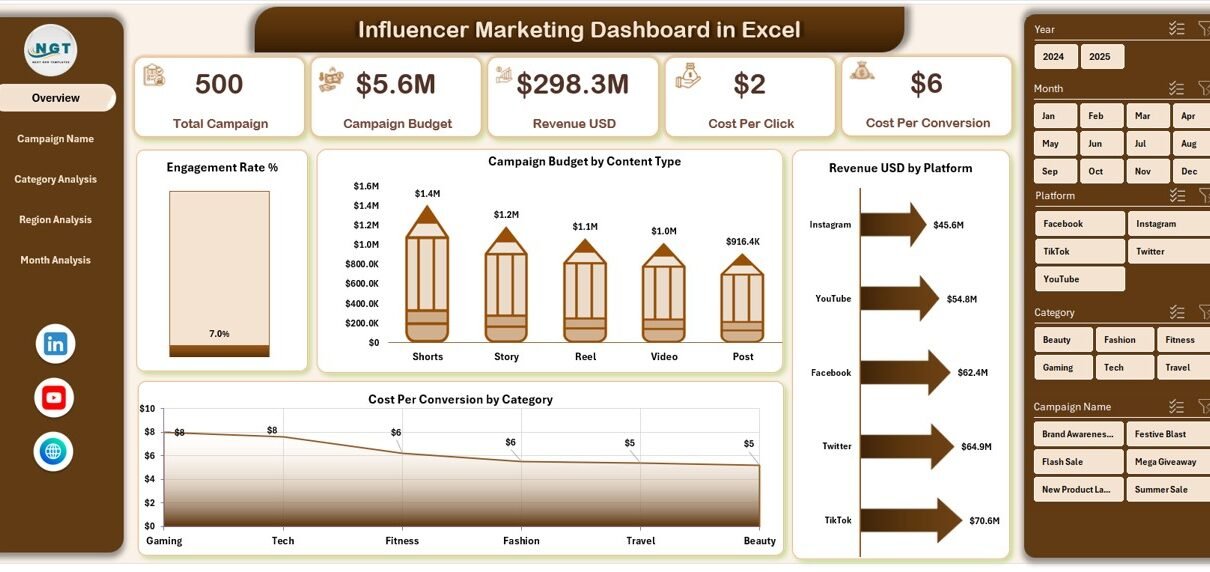
Influencer marketing has changed digital marketing completely. Brands no longer depend only on traditional ads. Instead, they collaborate with creators across platforms like Instagram, YouTube, and TikTok. However, many businesses
Read More
Dashboard

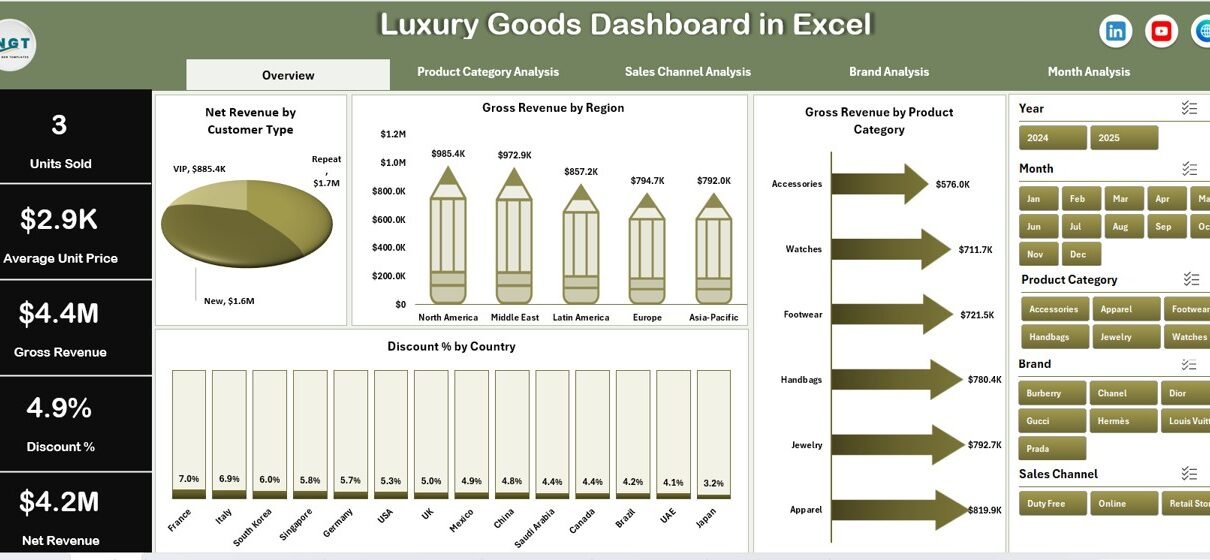
Luxury Goods Dashboard in Excel

January 28, 2026January 28, 2026 PKComments Off on Luxury Goods Dashboard in Excel
Luxury brands operate in a world where precision, exclusivity, and performance matter deeply. While aesthetics define luxury, data defines success. However, many luxury businesses still rely on scattered spreadsheets, manual
Read More
Dashboard

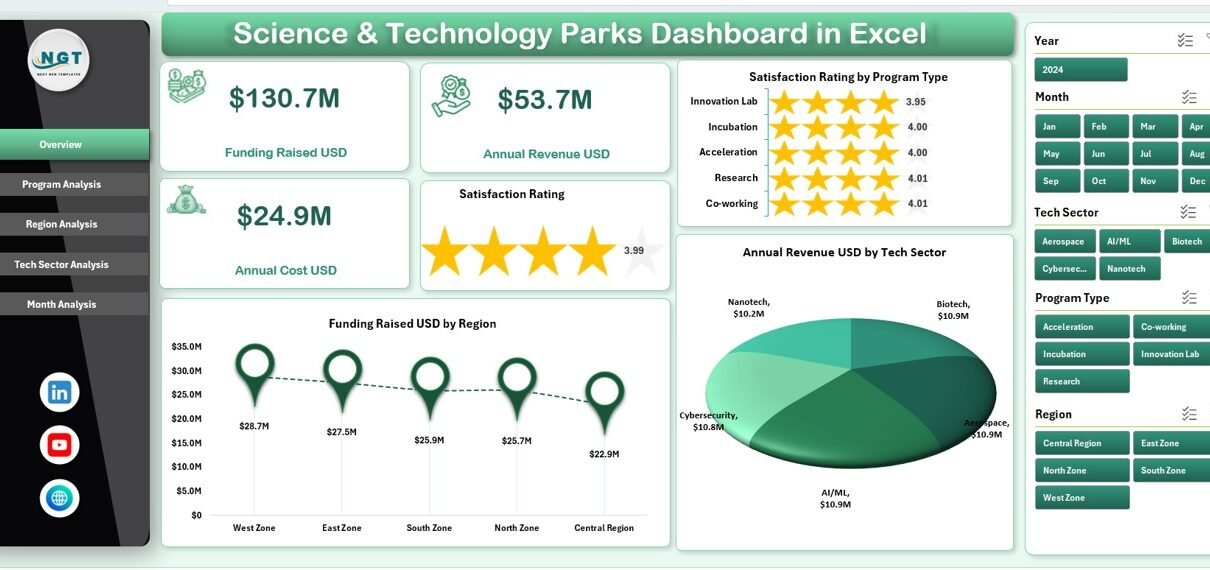
Science & Technology Parks Dashboard in Excel

December 12, 2025December 12, 2025 PKComments Off on Science & Technology Parks Dashboard in Excel
In today’s innovation-driven economy, Science & Technology Parks play a crucial role in supporting startups, research institutions, and technology-driven enterprises. However, managing data related to funding, revenue, costs, programs, regions,
Read More
Dashboard

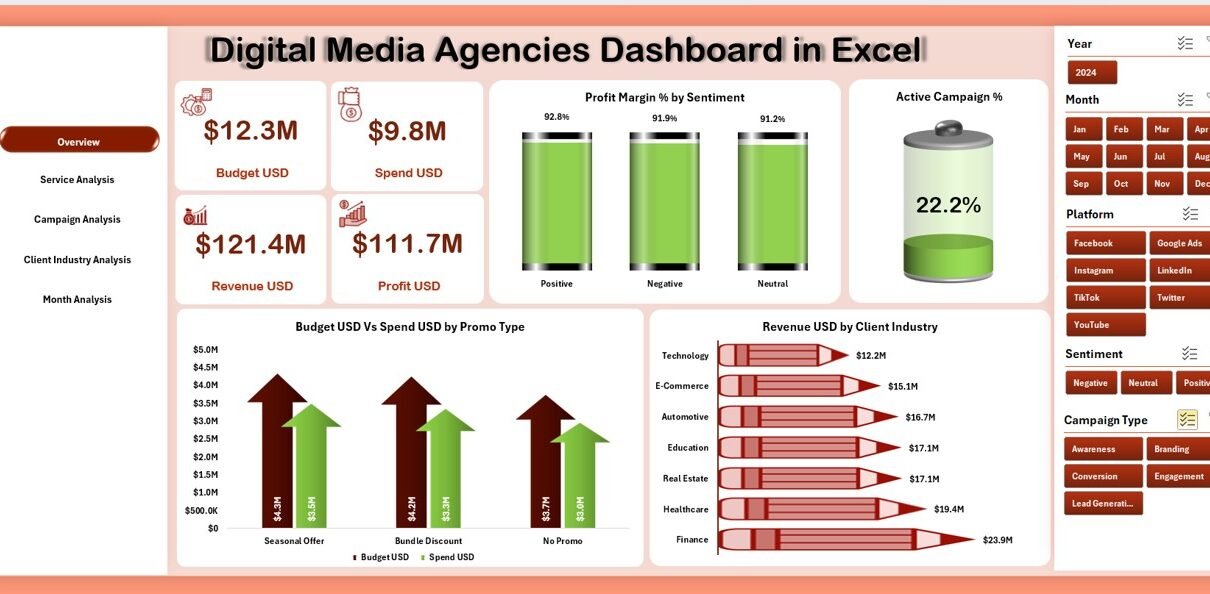
Digital Media Agencies Dashboard in Excel

November 22, 2025November 22, 2025 PKComments Off on Digital Media Agencies Dashboard in Excel
Digital media agencies handle multiple clients, campaigns, platforms, deliverables, and performance indicators every day. Because of this fast-paced environment, managers, analysts, and decision-makers need reliable tools that provide quick insights
Read More
Dashboard

Accounting Firms Dashboard in Excel

November 14, 2025November 14, 2025 PKComments Off on Accounting Firms Dashboard in Excel
Accounting firms handle huge volumes of financial data every single day. Teams monitor revenue, expenses, client satisfaction, service performance, engagements, and monthly profitability. Because so many things happen at once,
Read More
  • Learn Excel (Free Course)
    • 1. Shortcut Keys
    • 2. Fill & Flash Fill
    • 3. Find & Replace
    • 4. Sort & Filter
    • 5. Formulas & Functions
    • 6. Data Validation
    • 7. Conditional Formatting
    • 8. Basic Charts
    • 9. Advanced Charts
    • 10. Pivot Tables
    • 11. Excel Dashboards
    • 12. VBA Course
    • 13. Excel Formulas with AI
  • Templates
  • Tutorials
    • Charts and Visualization
    • VBA
    • Excel Tips and Tricks
    • Excel Dashboards
    • Power Pivot & DAX
  • Power BI
  • Template Store
    • Ready to Use Templates
  • Courses
  • Academy
    • Excel + AI Mastery: 100 Formulas
    • Excel Pivot Tables & Dashboards
  • About Us
  • Contact Us
Copyright © 2023 PK-AnExcelExpert.com - Privacy Policy