New: NextGenTemplates Academy - video courses on Excel formulas with AI and Pivot Tables & dashboards. Early-bird: 20% off with code EARLYBIRD20 - first 20 orders only. See the courses →
  • Learn Excel (Free Course)
    • 1. Shortcut Keys
    • 2. Fill & Flash Fill
    • 3. Find & Replace
    • 4. Sort & Filter
    • 5. Formulas & Functions
    • 6. Data Validation
    • 7. Conditional Formatting
    • 8. Basic Charts
    • 9. Advanced Charts
    • 10. Pivot Tables
    • 11. Excel Dashboards
    • 12. VBA Course
    • 13. Excel Formulas with AI
  • Templates
  • Tutorials
    • Charts and Visualization
    • VBA
    • Excel Tips and Tricks
    • Excel Dashboards
    • Power Pivot & DAX
  • Power BI
  • Template Store
    • Ready to Use Templates
  • Courses
  • Academy
    • Excel + AI Mastery: 100 Formulas
    • Excel Pivot Tables & Dashboards
  • About Us
  • Contact Us

PK: An Excel Expert

Transforming Data into Decisions

Tag: Revenue Analysis Power BI

Dashboard Power BI

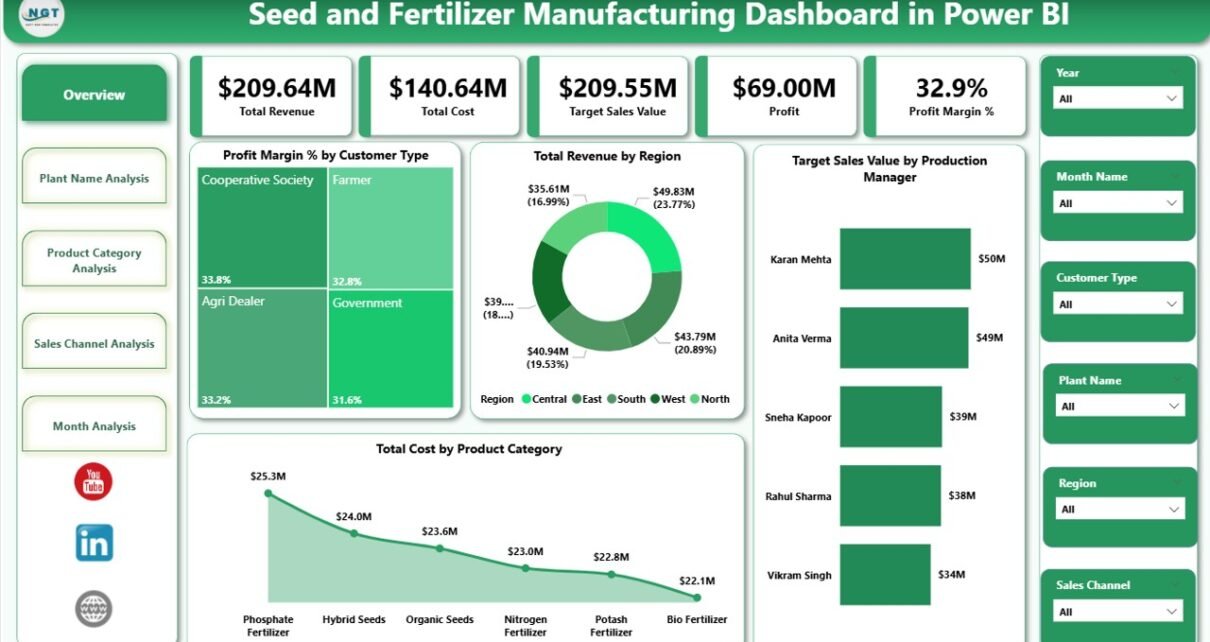
Seed and Fertilizer Manufacturing Dashboard in Power BI

February 8, 2026February 8, 2026 PKComments Off on Seed and Fertilizer Manufacturing Dashboard in Power BI
The agriculture industry moves fast. Demand changes with seasons. Raw material prices fluctuate often. Production targets shift frequently. Therefore, manufacturers must track revenue, cost, profit margin, plant performance, and sales
Read More
Dashboard Power BI

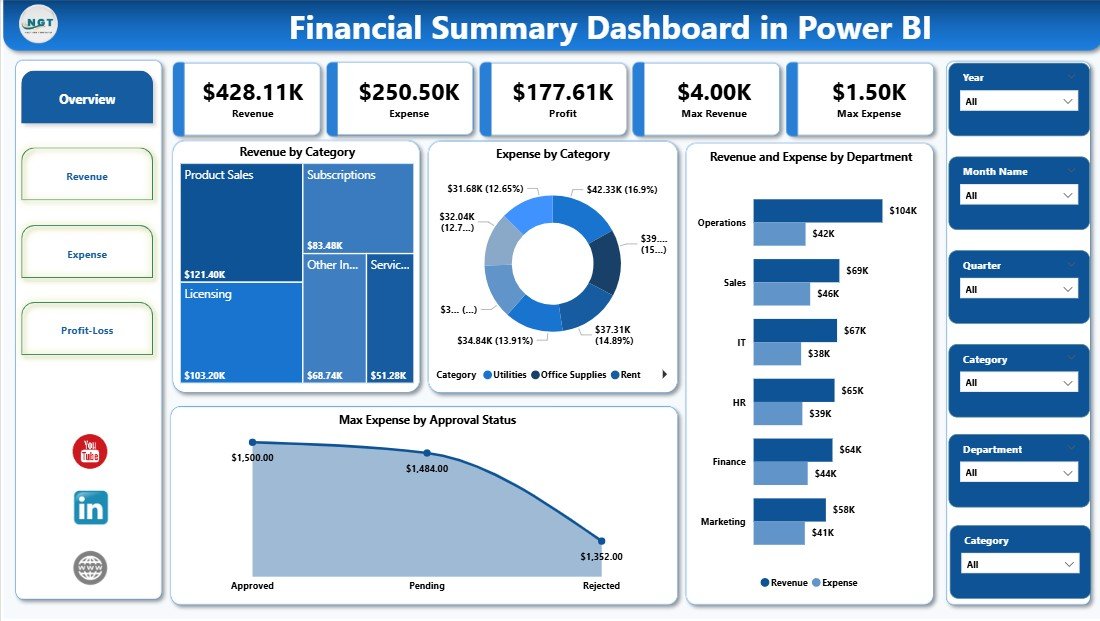
Financial Summary Dashboard in Power BI

January 12, 2026January 12, 2026 PKComments Off on Financial Summary Dashboard in Power BI
Managing finances without clear visibility always creates confusion. Many organizations track revenue, expenses, and profit in separate Excel files. As a result, leaders struggle to understand the complete financial picture.
Read More
Dashboard Power BI

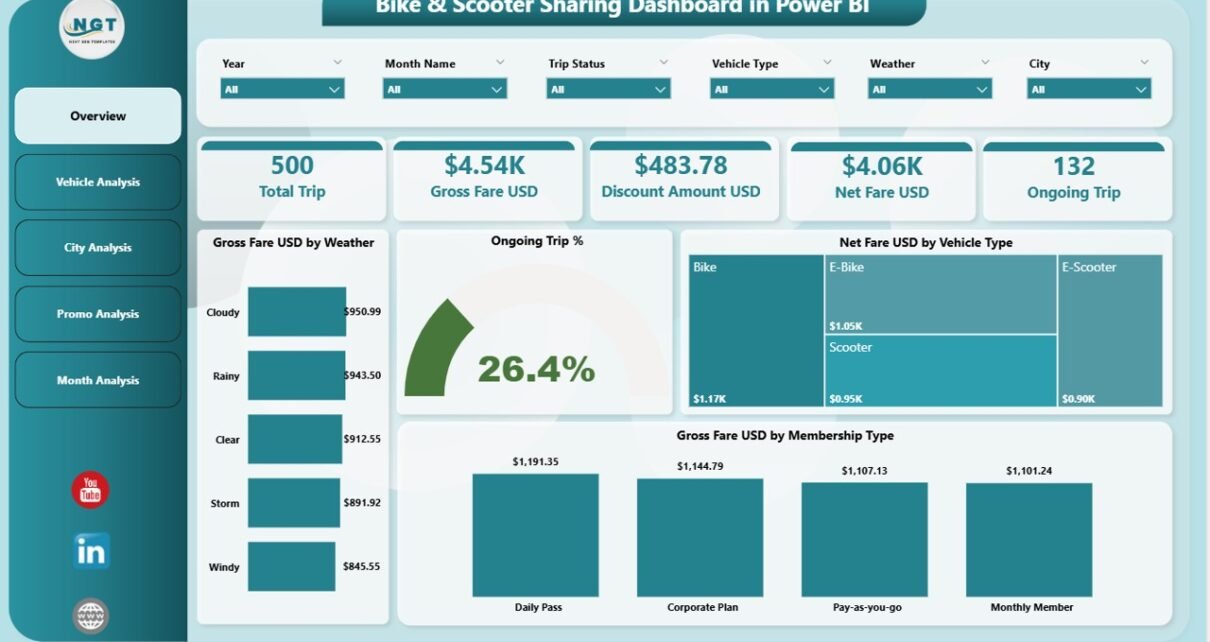
Bike & Scooter Sharing Dashboard in Power BI

December 2, 2025December 2, 2025 PKComments Off on Bike & Scooter Sharing Dashboard in Power BI
Urban mobility changes rapidly, and bike and scooter sharing systems continue to grow across major cities. Operators handle huge volumes of trip data every hour—weather conditions, membership types, trip durations,
Read More
  • Learn Excel (Free Course)
    • 1. Shortcut Keys
    • 2. Fill & Flash Fill
    • 3. Find & Replace
    • 4. Sort & Filter
    • 5. Formulas & Functions
    • 6. Data Validation
    • 7. Conditional Formatting
    • 8. Basic Charts
    • 9. Advanced Charts
    • 10. Pivot Tables
    • 11. Excel Dashboards
    • 12. VBA Course
    • 13. Excel Formulas with AI
  • Templates
  • Tutorials
    • Charts and Visualization
    • VBA
    • Excel Tips and Tricks
    • Excel Dashboards
    • Power Pivot & DAX
  • Power BI
  • Template Store
    • Ready to Use Templates
  • Courses
  • Academy
    • Excel + AI Mastery: 100 Formulas
    • Excel Pivot Tables & Dashboards
  • About Us
  • Contact Us
Copyright © 2023 PK-AnExcelExpert.com - Privacy Policy