New: NextGenTemplates Academy - video courses on Excel formulas with AI and Pivot Tables & dashboards. Early-bird: 20% off with code EARLYBIRD20 - first 20 orders only. See the courses →
  • Learn Excel (Free Course)
    • 1. Shortcut Keys
    • 2. Fill & Flash Fill
    • 3. Find & Replace
    • 4. Sort & Filter
    • 5. Formulas & Functions
    • 6. Data Validation
    • 7. Conditional Formatting
    • 8. Basic Charts
    • 9. Advanced Charts
    • 10. Pivot Tables
    • 11. Excel Dashboards
    • 12. VBA Course
    • 13. Excel Formulas with AI
  • Templates
  • Tutorials
    • Charts and Visualization
    • VBA
    • Excel Tips and Tricks
    • Excel Dashboards
    • Power Pivot & DAX
  • Power BI
  • Template Store
    • Ready to Use Templates
  • Courses
  • Academy
    • Excel + AI Mastery: 100 Formulas
    • Excel Pivot Tables & Dashboards
  • About Us
  • Contact Us

PK: An Excel Expert

Transforming Data into Decisions

Tag: revenue analysis

Dashboard Power BI

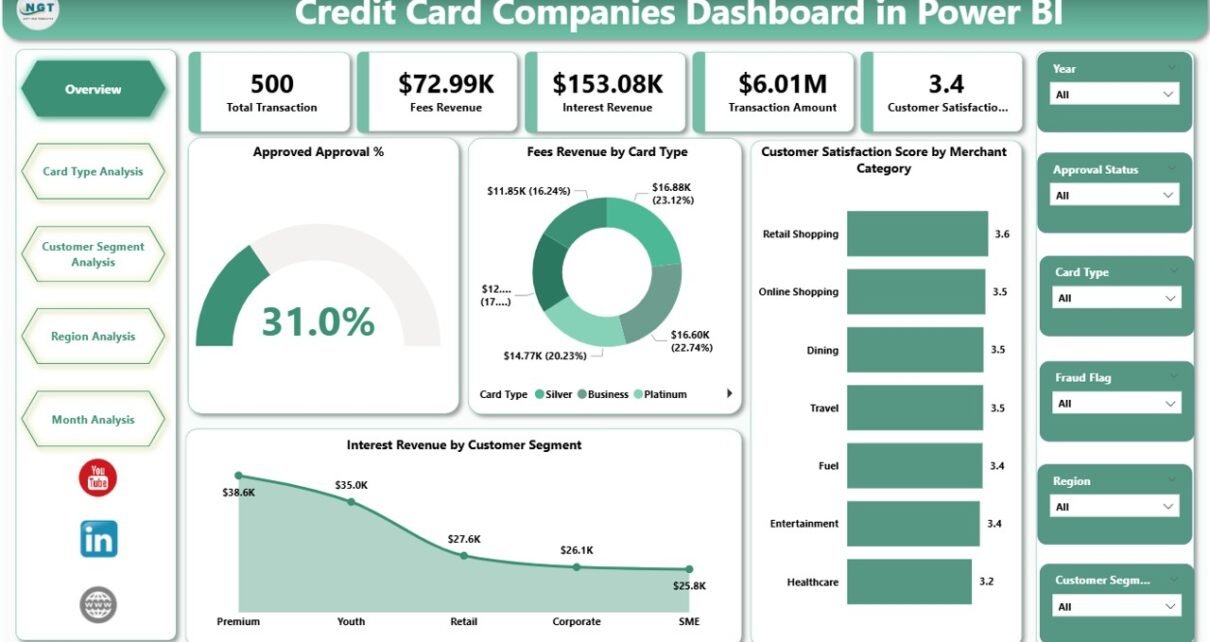
Credit Card Companies Dashboard in Power BI

February 26, 2026February 26, 2026 PKComments Off on Credit Card Companies Dashboard in Power BI
Modern financial institutions operate in a highly competitive and data-driven environment. Credit card companies process millions of transactions every day. Therefore, they must continuously monitor approvals, revenue streams, customer behavior,
Read More
Dashboard

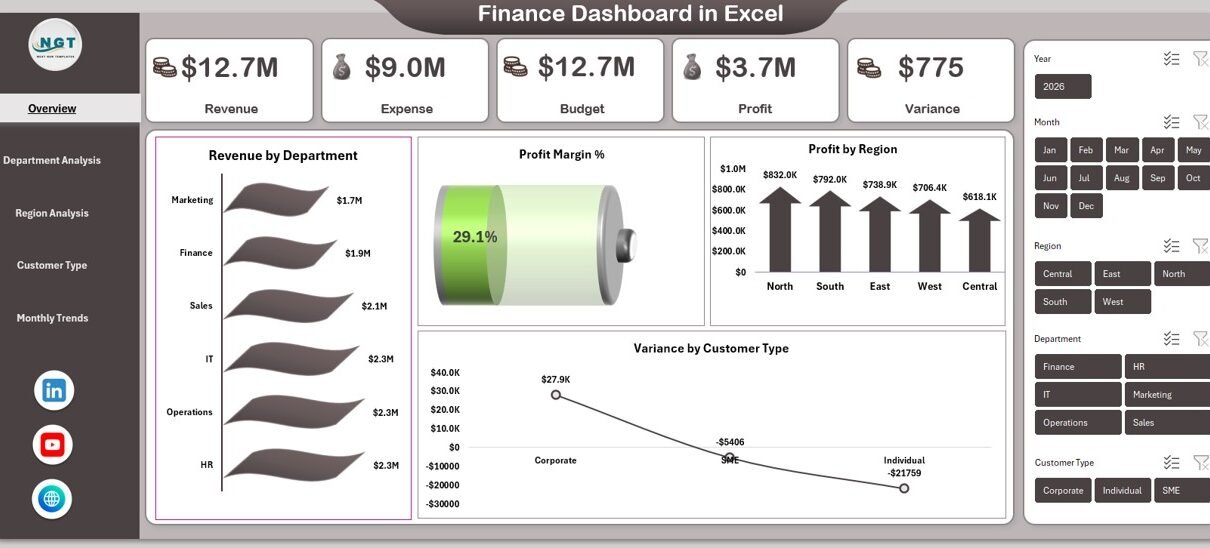
Finance Dashboard in Excel

February 23, 2026February 23, 2026 PKComments Off on Finance Dashboard in Excel
Financial management plays a critical role in every organization, regardless of size or industry. Companies constantly track revenue, expenses, budgets, and profits to ensure sustainable growth. However, many businesses still
Read More
Dashboard Power BI

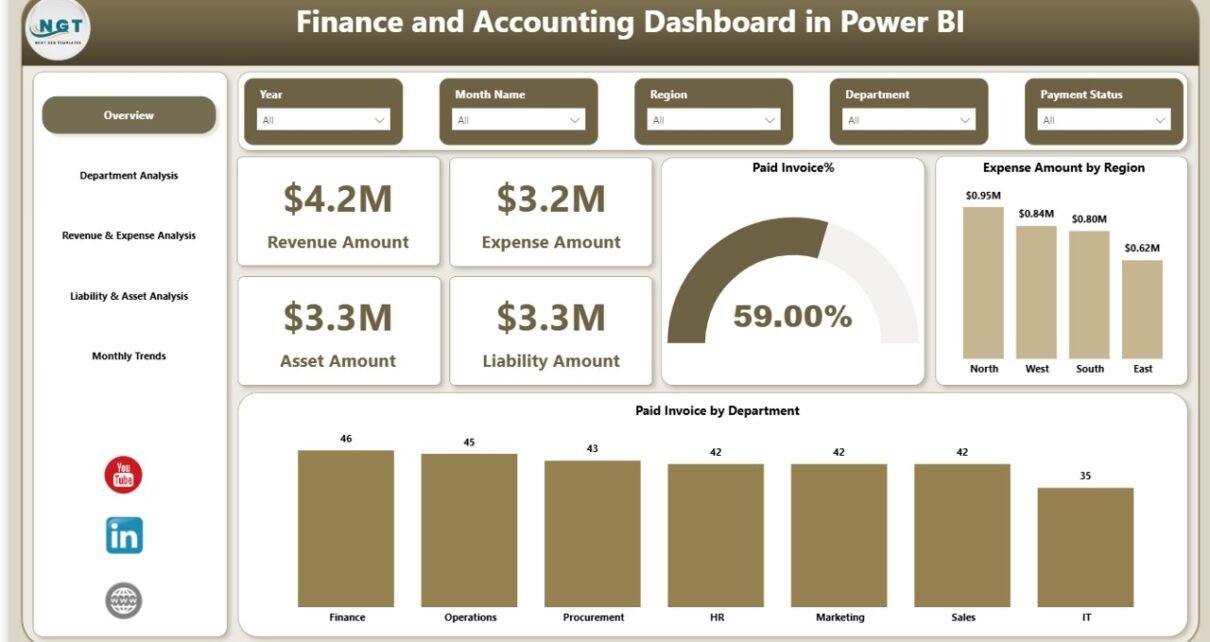
Finance and Accounting Dashboard in Power BI

February 21, 2026February 21, 2026 PKComments Off on Finance and Accounting Dashboard in Power BI
In today’s fast-moving business world, companies must track financial performance with clarity and speed. However, many organizations still depend on scattered Excel sheets and manual reports. As a result, finance
Read More
Dashboard Power BI

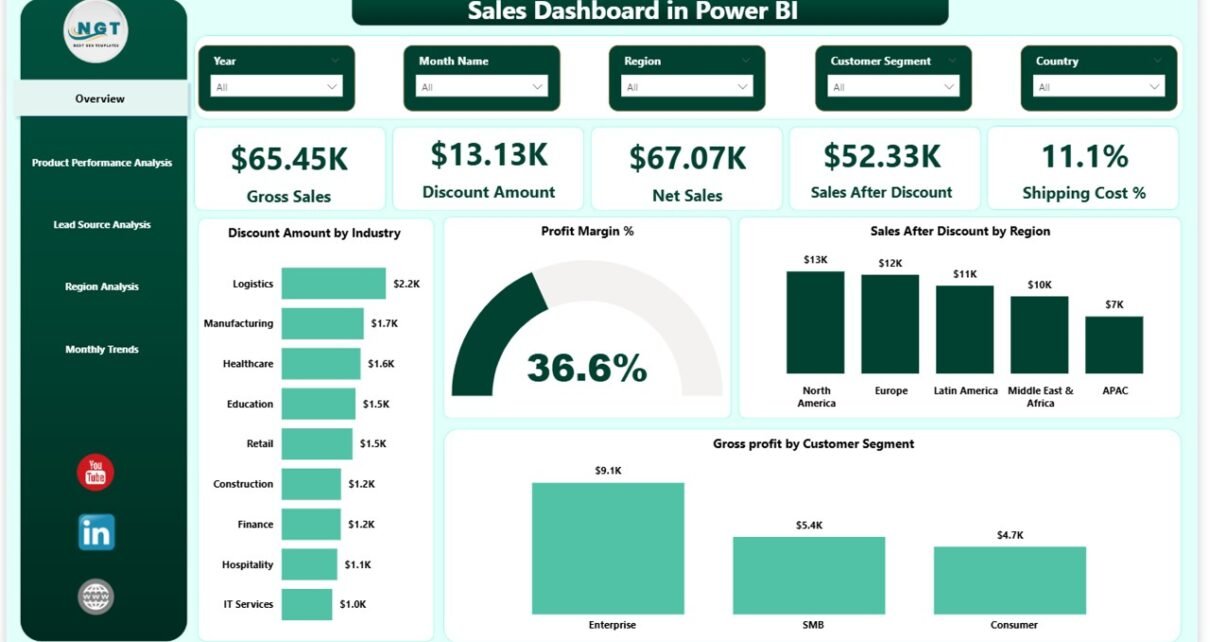
Sales Dashboard in Power BI

February 17, 2026February 17, 2026 PKComments Off on Sales Dashboard in Power BI
In today’s competitive business world, sales teams must make fast and smart decisions. However, many companies still rely on spreadsheets and manual reports. As a result, leaders struggle to track
Read More
Dashboard Power BI

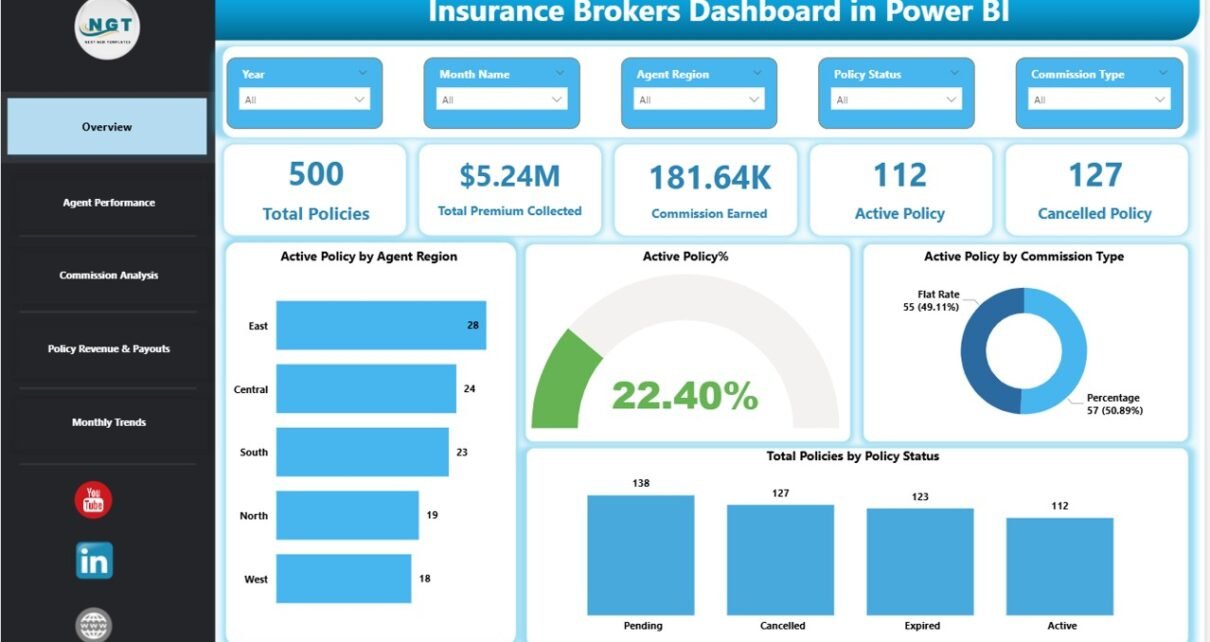
Insurance Brokers Dashboard in Power BI

February 12, 2026February 12, 2026 PKComments Off on Insurance Brokers Dashboard in Power BI
The insurance industry moves fast. Brokers handle hundreds of policies. Agents chase targets. Commissions change every month. Moreover, leaders need real-time numbers to make smart decisions.However, many brokerage firms still
Read More
Dashboard

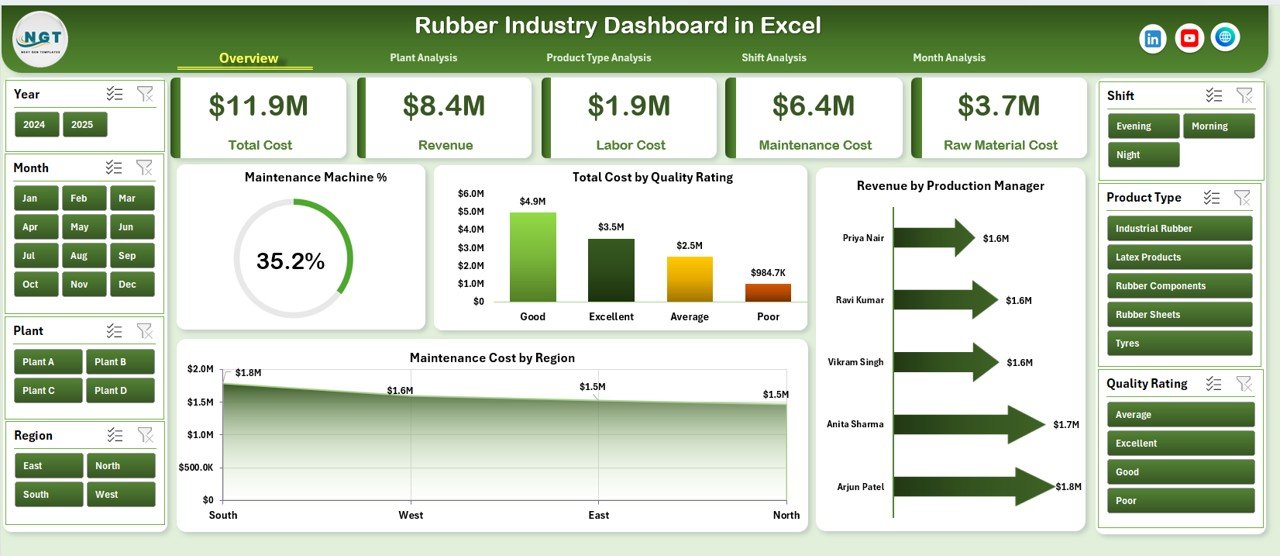
Rubber Industry Dashboard in Excel

February 12, 2026February 12, 2026 PKComments Off on Rubber Industry Dashboard in Excel
The rubber industry runs on precision, cost control, and production efficiency. However, many rubber manufacturers still depend on scattered spreadsheets. As a result, leaders struggle to monitor plant performance, labor
Read More
Dashboard Power BI

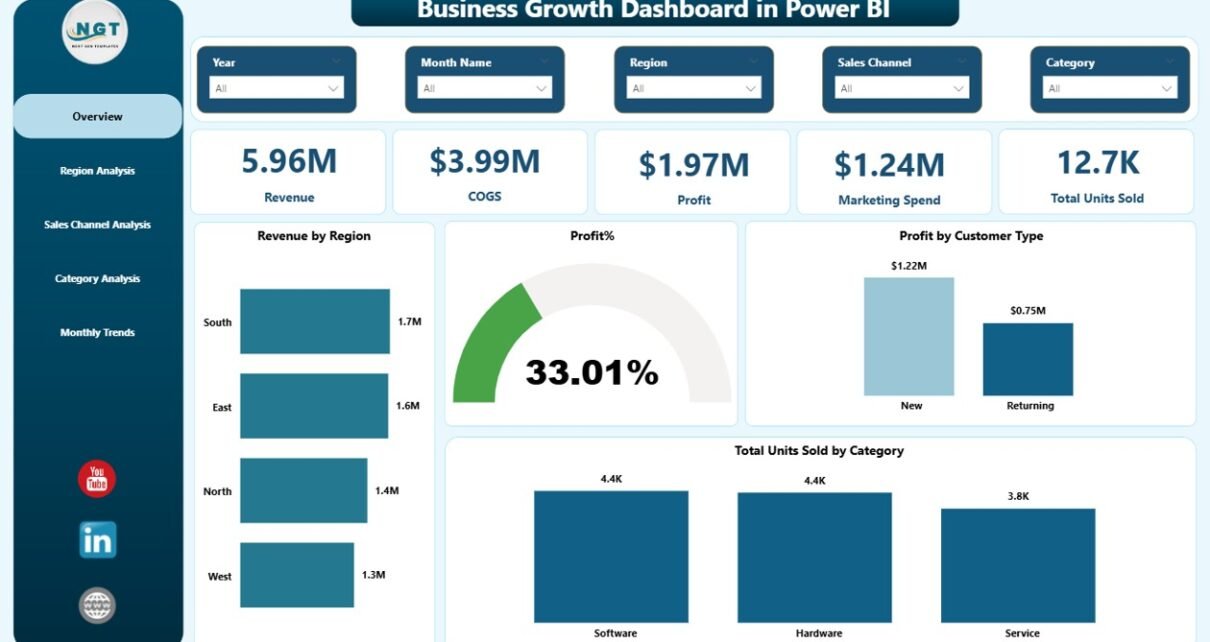
Business Growth Dashboard in Power BI

February 8, 2026February 8, 2026 PKComments Off on Business Growth Dashboard in Power BI
In today’s competitive market, businesses must move fast. Markets change quickly. Customer preferences shift constantly. Costs rise unexpectedly. Therefore, companies must track performance in real time. However, many organizations still
Read More
Dashboard Power BI

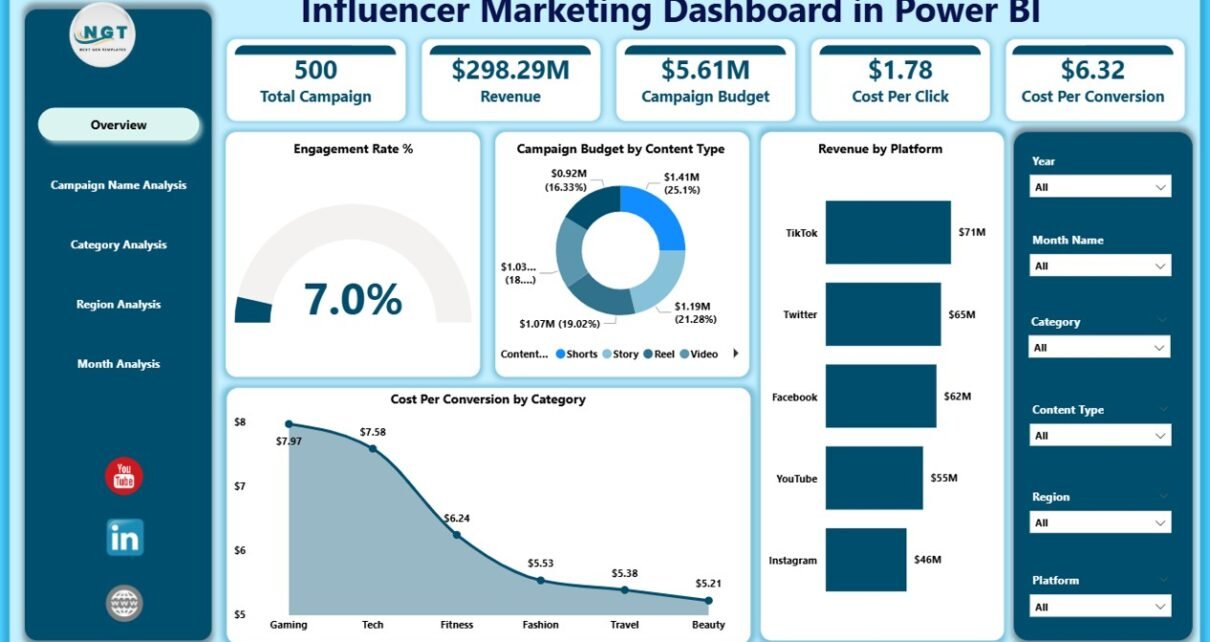
Influencer Marketing Dashboard in Power BI

February 6, 2026February 6, 2026 PKComments Off on Influencer Marketing Dashboard in Power BI
Influencer Marketing Dashboard is no longer optional. Brands now compete for attention on Instagram, YouTube, TikTok, and other platforms every single day. However, many marketing teams still track campaign results
Read More
Dashboard Power BI

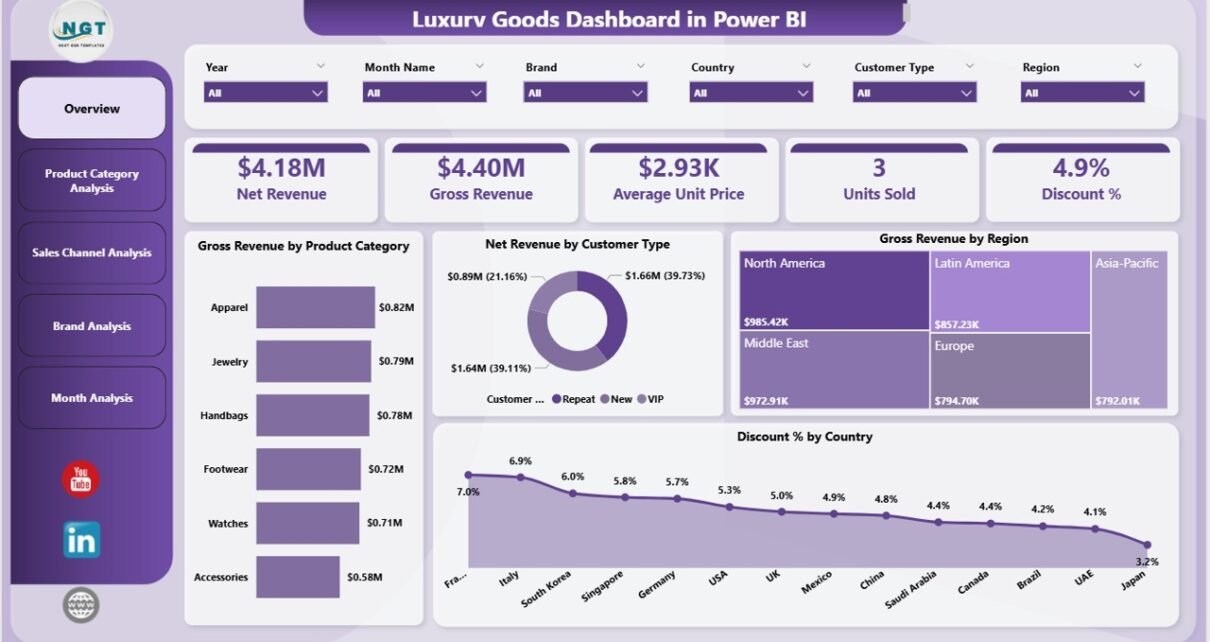
Luxury Goods Dashboard in Power BI

January 28, 2026January 28, 2026 PKComments Off on Luxury Goods Dashboard in Power BI
Luxury brands operate in a highly competitive, data-driven, and experience-focused market. Customers expect premium quality, personalized service, and consistent brand value. At the same time, leadership teams must track revenue,
Read More
Dashboard

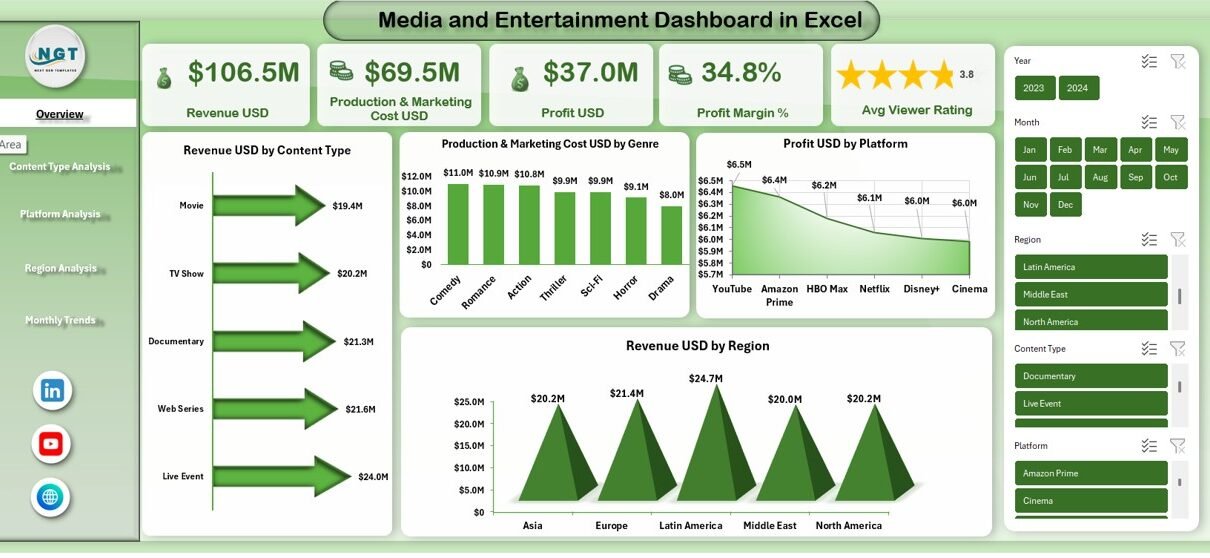
Media and Entertainment Dashboard in Excel

December 22, 2025December 22, 2025 PKComments Off on Media and Entertainment Dashboard in Excel
Media and entertainment businesses move fast. Every day, studios, OTT platforms, broadcasters, and digital creators track revenue, costs, ratings, views, and audience engagement. However, when data stays scattered across multiple
Read More

Posts pagination

Previous 1 2 3 Next
  • Learn Excel (Free Course)
    • 1. Shortcut Keys
    • 2. Fill & Flash Fill
    • 3. Find & Replace
    • 4. Sort & Filter
    • 5. Formulas & Functions
    • 6. Data Validation
    • 7. Conditional Formatting
    • 8. Basic Charts
    • 9. Advanced Charts
    • 10. Pivot Tables
    • 11. Excel Dashboards
    • 12. VBA Course
    • 13. Excel Formulas with AI
  • Templates
  • Tutorials
    • Charts and Visualization
    • VBA
    • Excel Tips and Tricks
    • Excel Dashboards
    • Power Pivot & DAX
  • Power BI
  • Template Store
    • Ready to Use Templates
  • Courses
  • Academy
    • Excel + AI Mastery: 100 Formulas
    • Excel Pivot Tables & Dashboards
  • About Us
  • Contact Us
Copyright © 2023 PK-AnExcelExpert.com - Privacy Policy