New: NextGenTemplates Academy - video courses on Excel formulas with AI and Pivot Tables & dashboards. Early-bird: 20% off with code EARLYBIRD20 - first 20 orders only. See the courses →
  • Learn Excel (Free Course)
    • 1. Shortcut Keys
    • 2. Fill & Flash Fill
    • 3. Find & Replace
    • 4. Sort & Filter
    • 5. Formulas & Functions
    • 6. Data Validation
    • 7. Conditional Formatting
    • 8. Basic Charts
    • 9. Advanced Charts
    • 10. Pivot Tables
    • 11. Excel Dashboards
    • 12. VBA Course
    • 13. Excel Formulas with AI
  • Templates
  • Tutorials
    • Charts and Visualization
    • VBA
    • Excel Tips and Tricks
    • Excel Dashboards
    • Power Pivot & DAX
  • Power BI
  • Template Store
    • Ready to Use Templates
  • Courses
  • Academy
    • Excel + AI Mastery: 100 Formulas
    • Excel Pivot Tables & Dashboards
  • About Us
  • Contact Us

PK: An Excel Expert

Transforming Data into Decisions

Tag: Risk Management KPIs

Dashboard Power BI

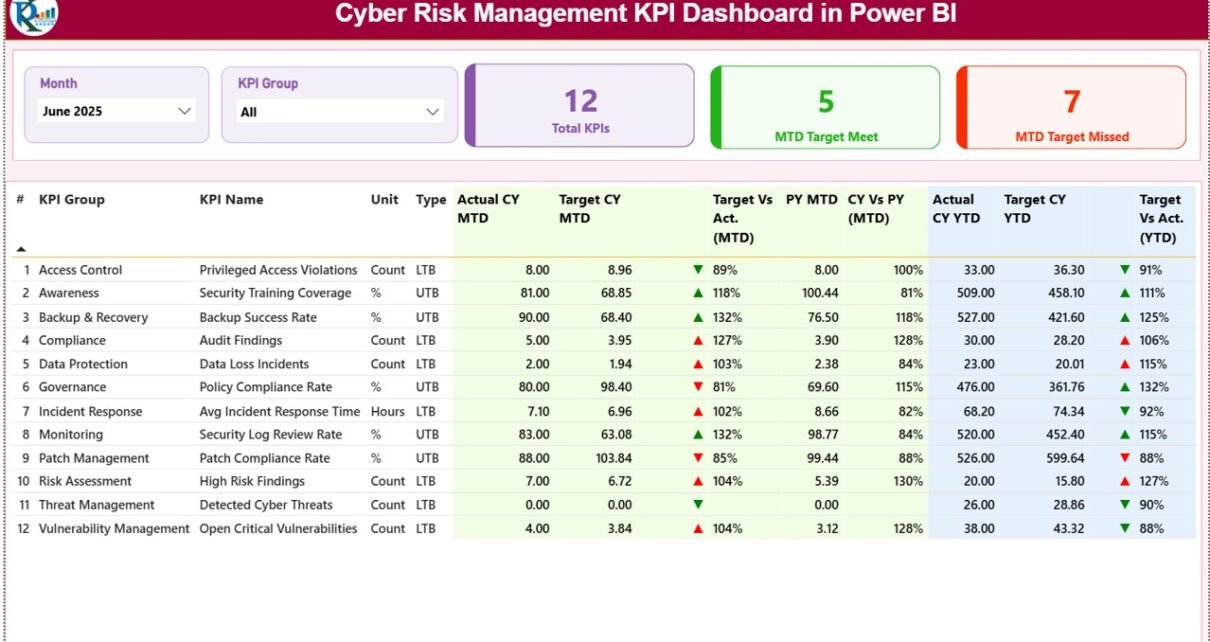
Cyber Risk Management KPI Dashboard in Power BI

January 27, 2026January 27, 2026 PKComments Off on Cyber Risk Management KPI Dashboard in Power BI
Cyber threats continue to grow every year. Therefore, organizations now need a structured and data-driven approach to monitor cyber risks. However, manual reports, static spreadsheets, and scattered data often fail
Read More
Dashboard

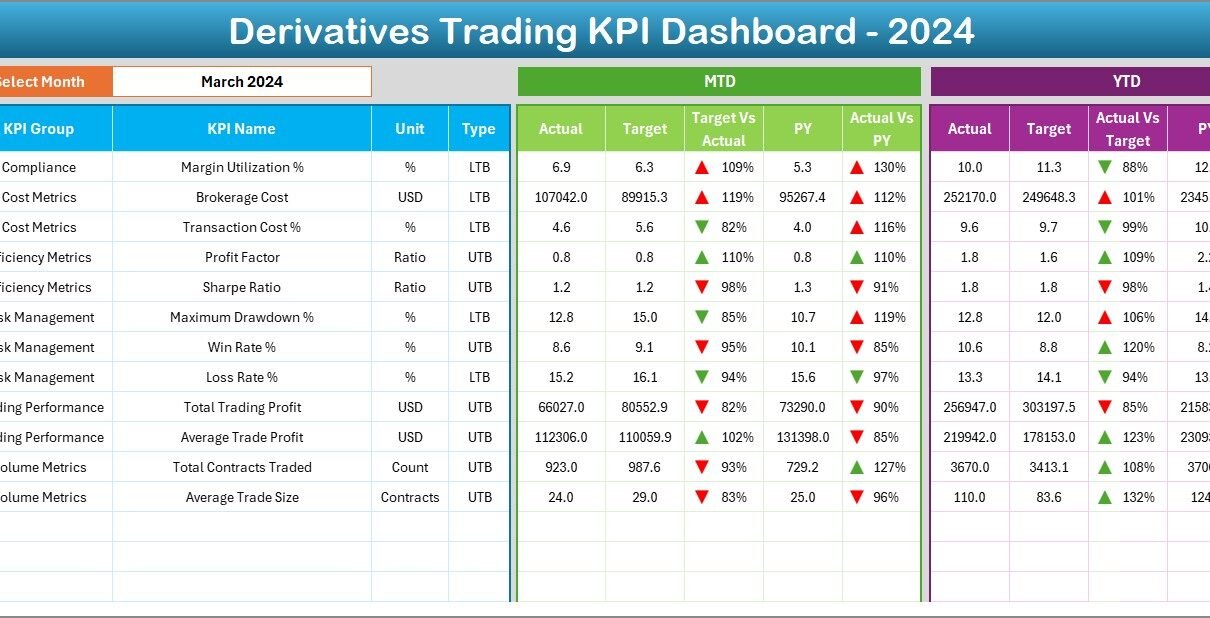
Derivatives Trading KPI Dashboard in Excel

December 9, 2025December 9, 2025 PKComments Off on Derivatives Trading KPI Dashboard in Excel
Derivatives trading involves high risk, fast decisions, and constant performance pressure. Traders, portfolio managers, and risk teams must track results daily, monthly, and yearly to stay profitable and compliant. However,
Read More
Dashboard Power BI

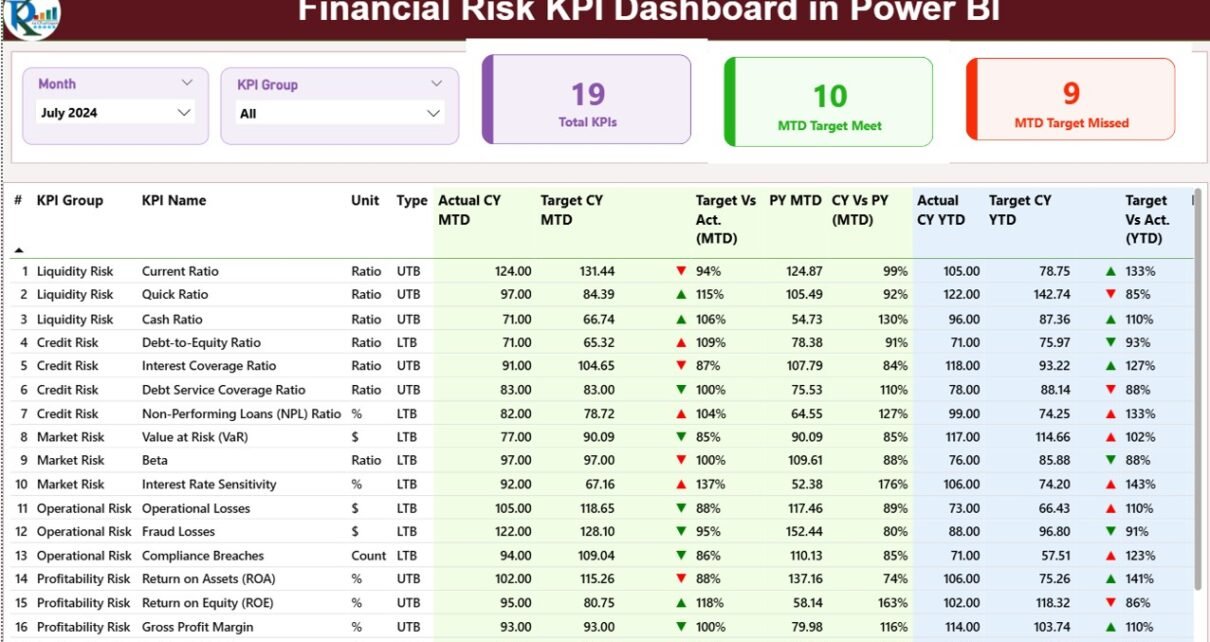
Financial Risk KPI Dashboard in Power BI

December 6, 2025December 6, 2025 PKComments Off on Financial Risk KPI Dashboard in Power BI
Financial risk plays a critical role in every organization, regardless of size or industry. Companies face risks related to liquidity, credit, compliance, cost overruns, volatility, and performance gaps on a
Read More
  • Learn Excel (Free Course)
    • 1. Shortcut Keys
    • 2. Fill & Flash Fill
    • 3. Find & Replace
    • 4. Sort & Filter
    • 5. Formulas & Functions
    • 6. Data Validation
    • 7. Conditional Formatting
    • 8. Basic Charts
    • 9. Advanced Charts
    • 10. Pivot Tables
    • 11. Excel Dashboards
    • 12. VBA Course
    • 13. Excel Formulas with AI
  • Templates
  • Tutorials
    • Charts and Visualization
    • VBA
    • Excel Tips and Tricks
    • Excel Dashboards
    • Power Pivot & DAX
  • Power BI
  • Template Store
    • Ready to Use Templates
  • Courses
  • Academy
    • Excel + AI Mastery: 100 Formulas
    • Excel Pivot Tables & Dashboards
  • About Us
  • Contact Us
Copyright © 2023 PK-AnExcelExpert.com - Privacy Policy