New: NextGenTemplates Academy - video courses on Excel formulas with AI and Pivot Tables & dashboards. Early-bird: 20% off with code EARLYBIRD20 - first 20 orders only. See the courses →
  • Learn Excel (Free Course)
    • 1. Shortcut Keys
    • 2. Fill & Flash Fill
    • 3. Find & Replace
    • 4. Sort & Filter
    • 5. Formulas & Functions
    • 6. Data Validation
    • 7. Conditional Formatting
    • 8. Basic Charts
    • 9. Advanced Charts
    • 10. Pivot Tables
    • 11. Excel Dashboards
    • 12. VBA Course
    • 13. Excel Formulas with AI
  • Templates
  • Tutorials
    • Charts and Visualization
    • VBA
    • Excel Tips and Tricks
    • Excel Dashboards
    • Power Pivot & DAX
  • Power BI
  • Template Store
    • Ready to Use Templates
  • Courses
  • Academy
    • Excel + AI Mastery: 100 Formulas
    • Excel Pivot Tables & Dashboards
  • About Us
  • Contact Us

PK: An Excel Expert

Transforming Data into Decisions

Tag: Sales Metrics

Templates

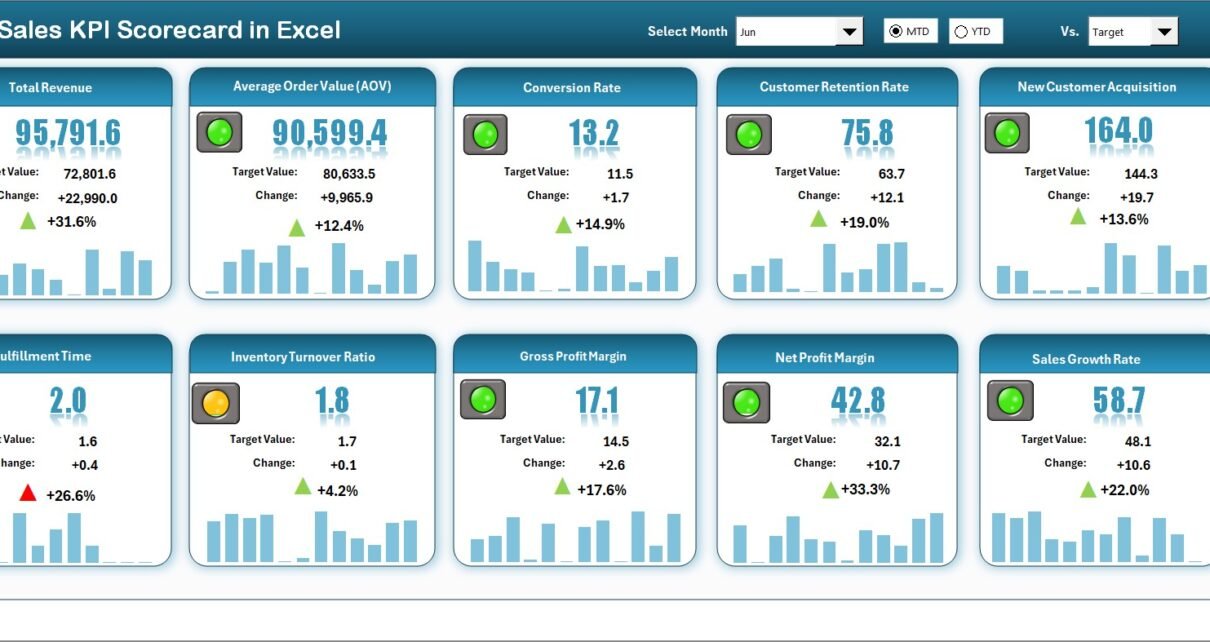
Sales KPI Scorecard in Excel

October 7, 2025October 7, 2025 PKComments Off on Sales KPI Scorecard in Excel
In today’s competitive business environment, tracking performance metrics has become essential for every organization that wants to grow. Sales departments, in particular, must measure and monitor key indicators to ensure
Read More
Power BI

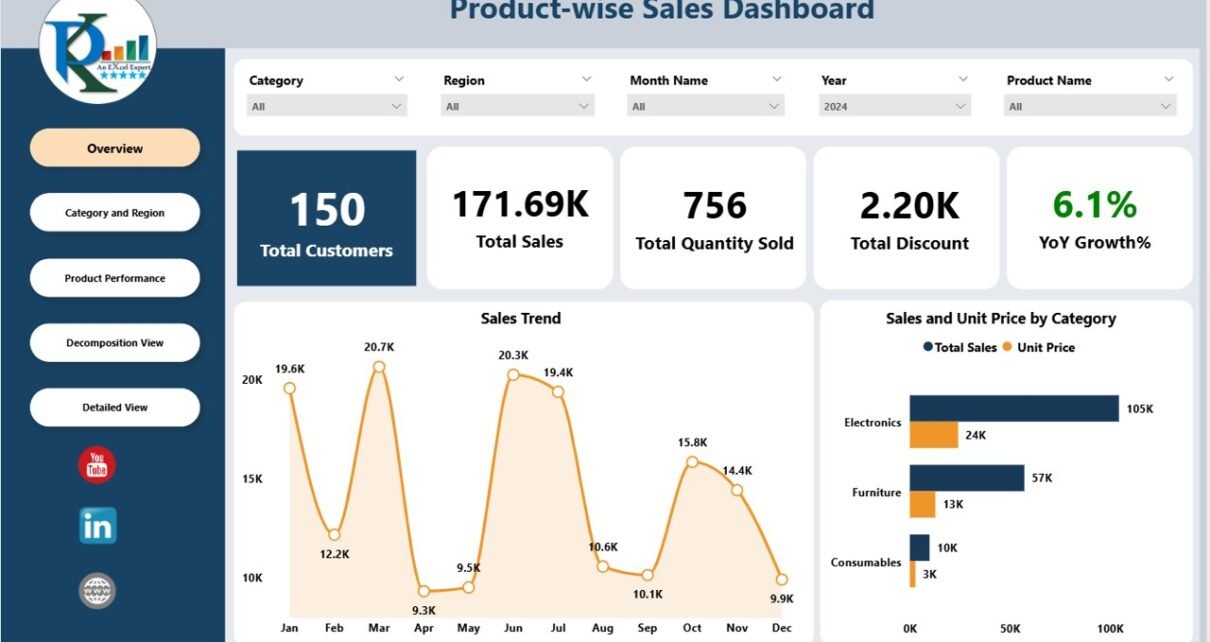
Product-wise Sales Dashboard in Power Bi

August 18, 2025August 18, 2025 PKComments Off on Product-wise Sales Dashboard in Power Bi
Managing sales data efficiently is critical for business growth. Understanding product performance, regional sales, and customer trends allows managers to make informed decisions. To simplify this process, we have created
Read More
Dashboard

Sales Business Intelligence Dashboard in Excel

July 16, 2025July 16, 2025 PKComments Off on Sales Business Intelligence Dashboard in Excel
In today's data-driven world, businesses rely heavily on dashboards to visualize and analyze their performance. A Sales Business Intelligence Dashboard in Excel provides a centralized view of key sales metrics,
Read More
Dashboard

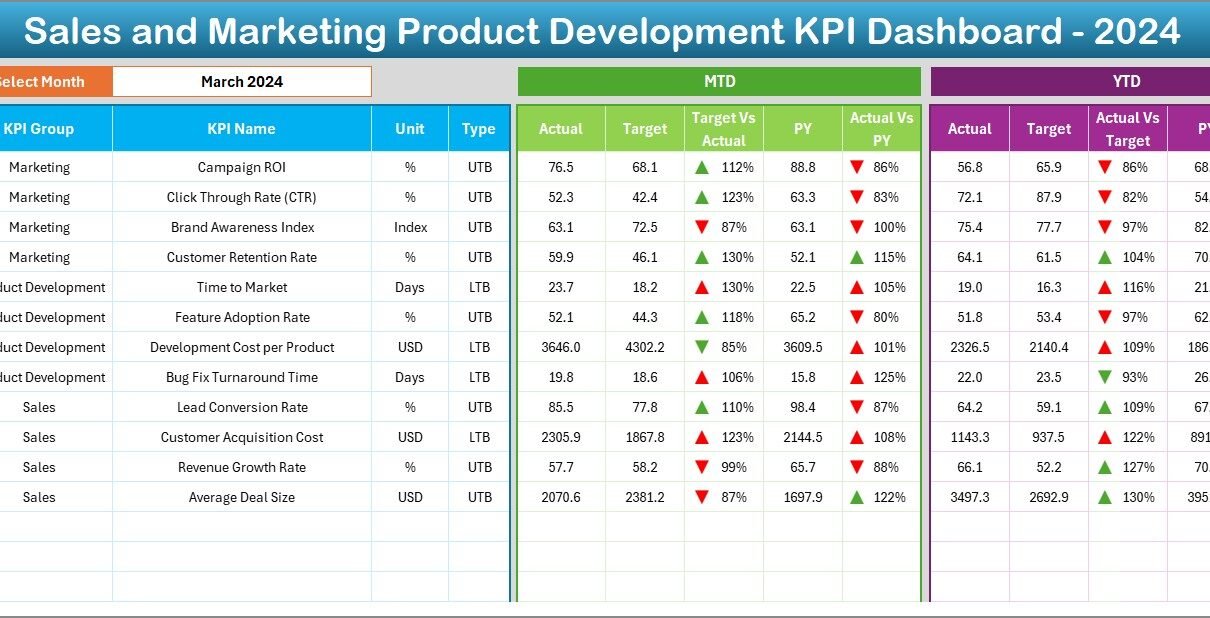
Sales and Marketing Product Development KPI Dashboard in Excel

April 17, 2025April 17, 2025 PKComments Off on Sales and Marketing Product Development KPI Dashboard in Excel
In today's fast-paced business world, tracking product development performance across sales and marketing is crucial. Whether you're a product manager, sales strategist, or marketing lead, having a clear view of
Read More
Dashboard

Water sales KPI Dashboard in Excel

April 1, 2025April 1, 2025 PKComments Off on Water sales KPI Dashboard in Excel
In the competitive world of water sales, managing performance effectively and efficiently is crucial. Whether you're a water supplier, utility manager, or sales team leader, tracking key metrics helps you
Read More
Dashboard

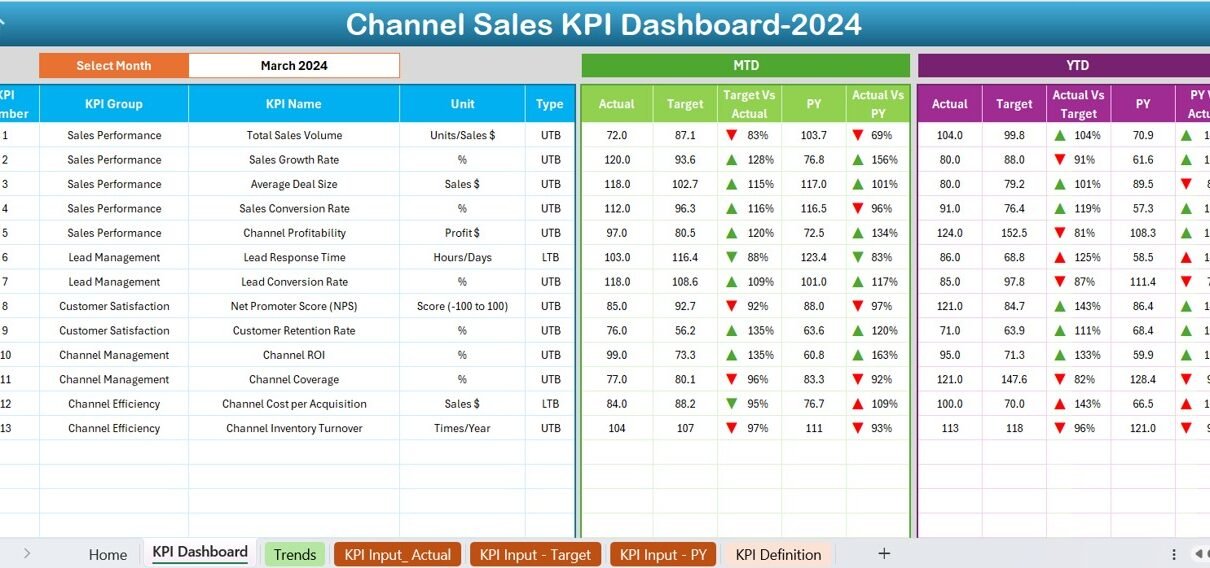
Channel Sales KPI Dashboard in Excel

January 26, 2025March 18, 2025 PKComments Off on Channel Sales KPI Dashboard in Excel
In the competitive world of channel sales, tracking performance is essential. A Channel Sales KPI Dashboard in Excel is a powerful tool that allows you to monitor key metrics, compare
Read More
Dashboard

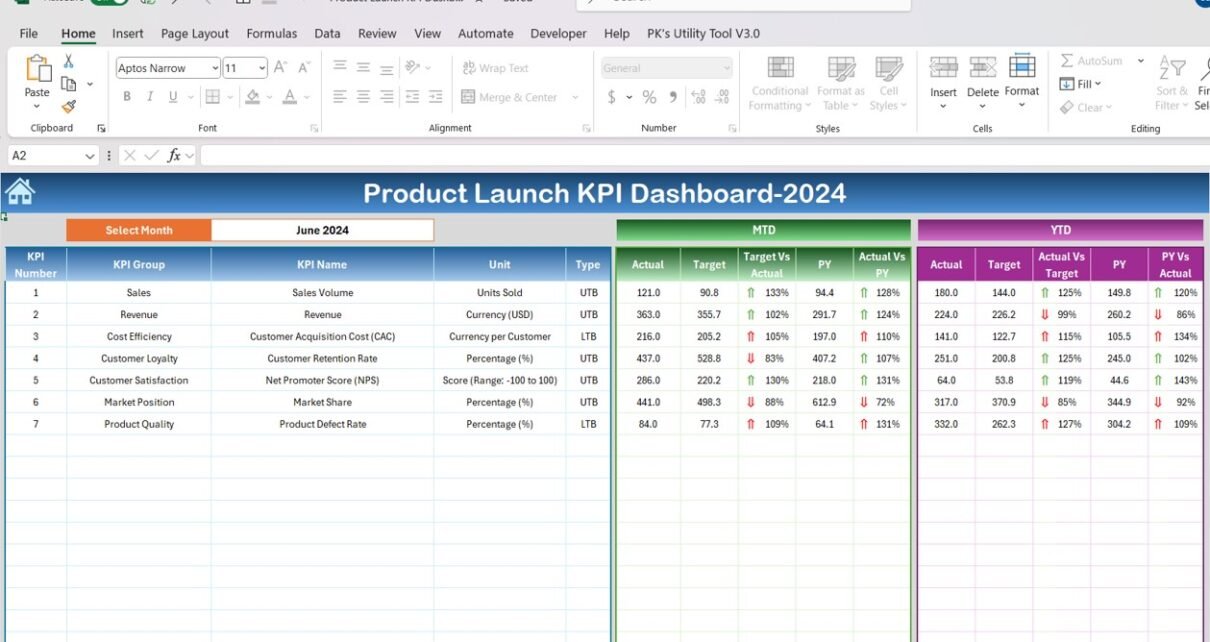
Product Launch KPI Dashboard

January 26, 2025March 19, 2025 PKComments Off on Product Launch KPI Dashboard
Launching a new product is a critical milestone for any business. It requires careful planning, execution, and constant monitoring to ensure its success in the market. A well-organized and structured
Read More
Dashboard Power BI

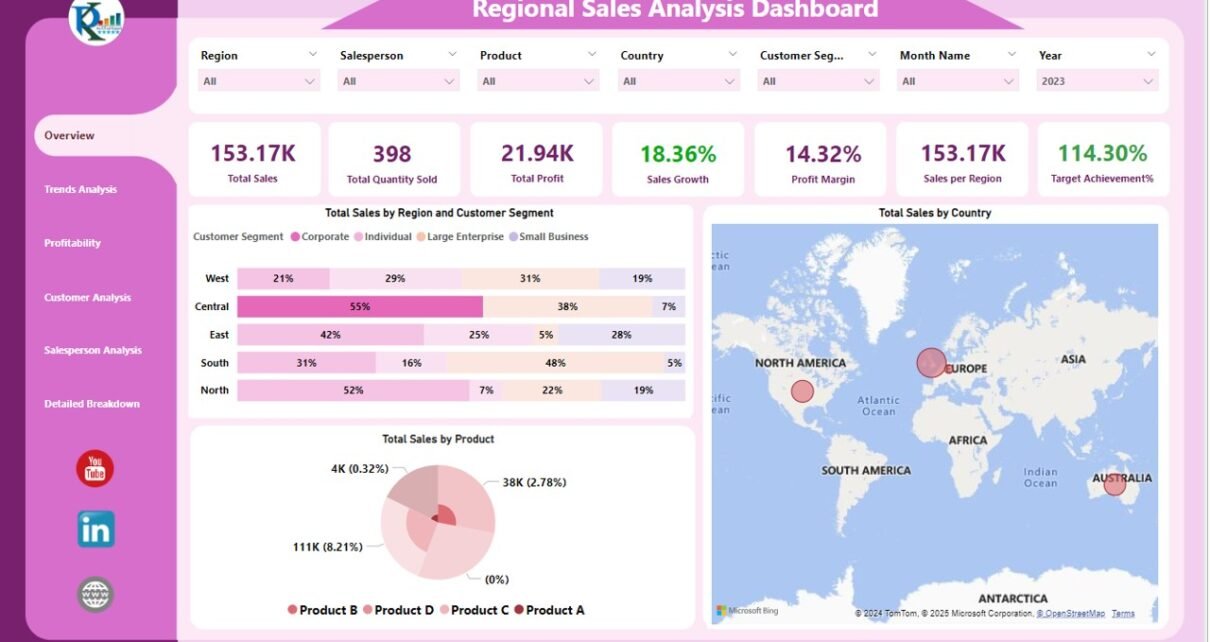
Regional Sales Analysis Dashboard in Power BI

January 12, 2025March 28, 2025 PKComments Off on Regional Sales Analysis Dashboard in Power BI
In today’s data-driven business environment, understanding and optimizing sales across various regions is crucial for sustaining growth and maintaining competitiveness. A Regional Sales Analysis Dashboard in Power BI provides a
Read More
Dashboard

Omnichannel Retail KPI Dashboard in Excel

December 31, 2024March 31, 2025 PKComments Off on Omnichannel Retail KPI Dashboard in Excel
The retail industry has evolved with the advancement of technology, shifting from a single-channel approach to an omnichannel strategy. With customers engaging with brands across multiple platforms – from physical
Read More
Dashboard

Luxury Retail KPI Dashboard in Excel

December 30, 2024April 11, 2025 PKComments Off on Luxury Retail KPI Dashboard in Excel
In today's competitive luxury retail market, having a strong understanding of performance metrics is essential to stay ahead of the curve. The key to gaining this insight is through an
Read More

Posts pagination

1 2 Next
  • Learn Excel (Free Course)
    • 1. Shortcut Keys
    • 2. Fill & Flash Fill
    • 3. Find & Replace
    • 4. Sort & Filter
    • 5. Formulas & Functions
    • 6. Data Validation
    • 7. Conditional Formatting
    • 8. Basic Charts
    • 9. Advanced Charts
    • 10. Pivot Tables
    • 11. Excel Dashboards
    • 12. VBA Course
    • 13. Excel Formulas with AI
  • Templates
  • Tutorials
    • Charts and Visualization
    • VBA
    • Excel Tips and Tricks
    • Excel Dashboards
    • Power Pivot & DAX
  • Power BI
  • Template Store
    • Ready to Use Templates
  • Courses
  • Academy
    • Excel + AI Mastery: 100 Formulas
    • Excel Pivot Tables & Dashboards
  • About Us
  • Contact Us
Copyright © 2023 PK-AnExcelExpert.com - Privacy Policy