New: NextGenTemplates Academy - video courses on Excel formulas with AI and Pivot Tables & dashboards. Early-bird: 20% off with code EARLYBIRD20 - first 20 orders only.See the courses →
PKComments Off on Carpooling Platforms Dashboard in Power BI
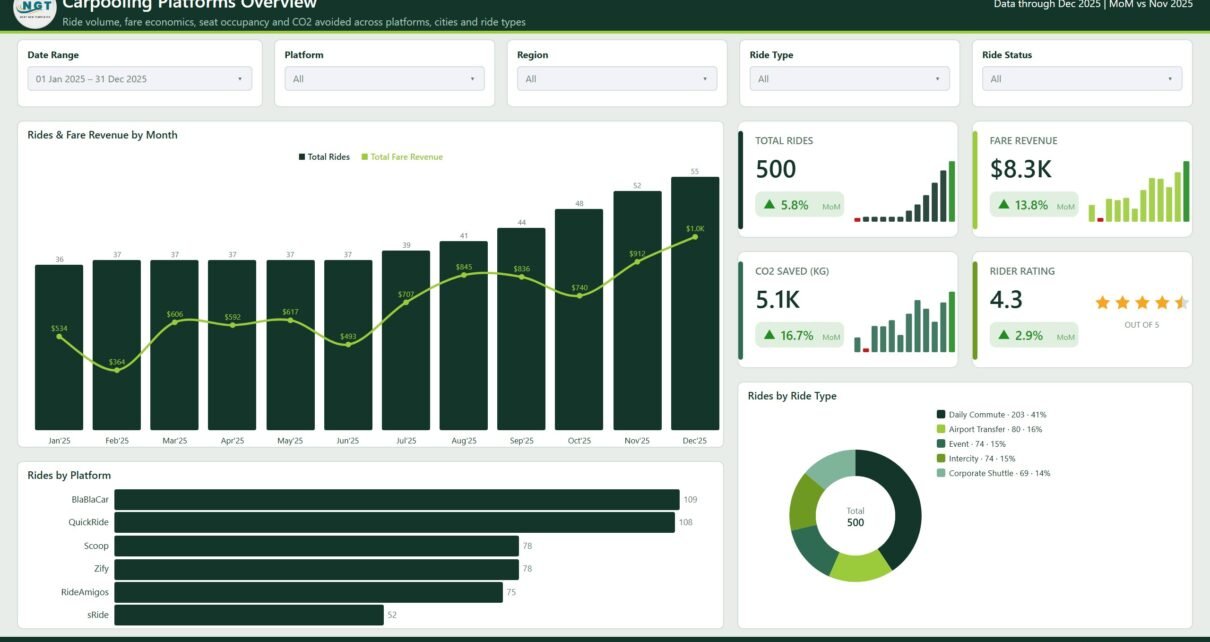
Most carpooling operators can tell you how many rides they ran last month. Far fewer can tell you, in the same breath, what share of the offered seats were actually
PKComments Off on Carpooling Platforms Dashboard in Excel
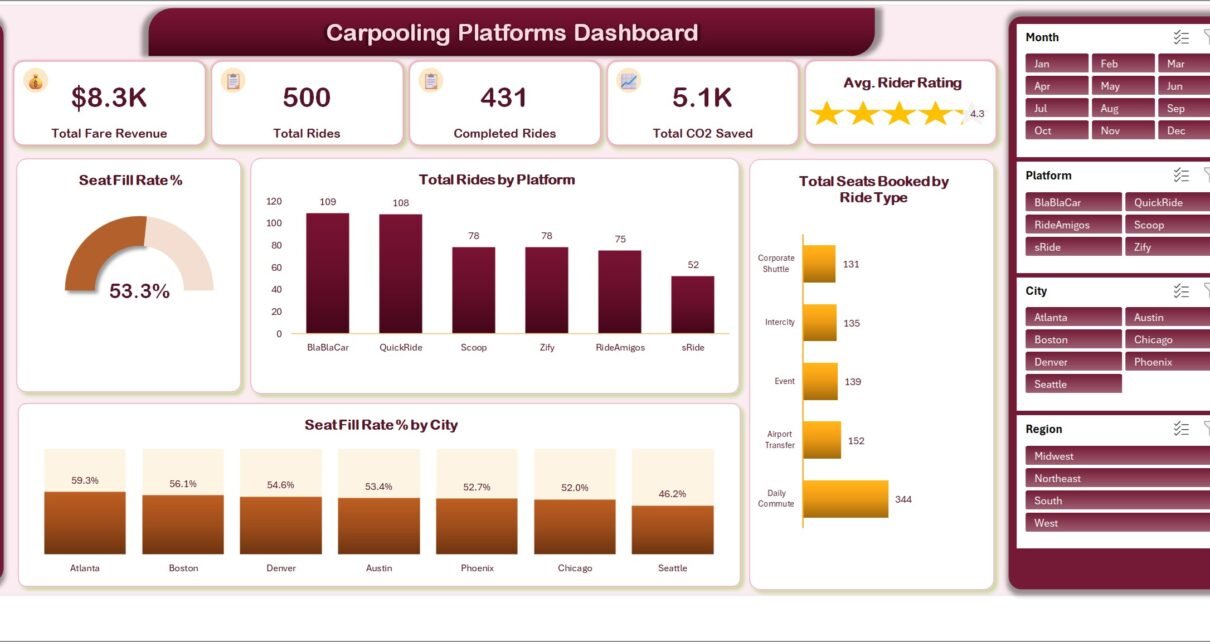
Carpooling operators sit on a lot of ride data and very little reporting. Every completed trip produces a fare, a driver payout, a seat count, a distance and a carbon
PKComments Off on Micro-Mobility Platforms Dashboard in Power BI
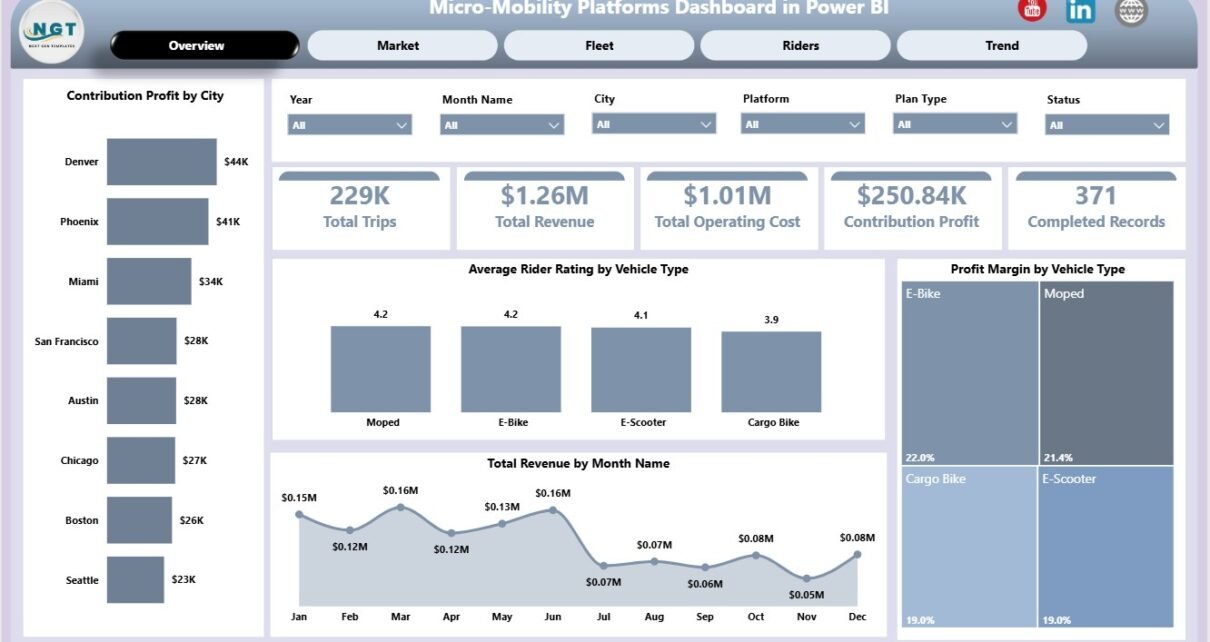
The Micro-Mobility Platforms Dashboard in Power BI helps shared scooter, bike-share, e-bike, and urban mobility teams review operations across 5 report pages, 5 executive KPI cards, and 18 focused chart
PKComments Off on Bike and Scooter Sharing KPI Dashboard in Excel
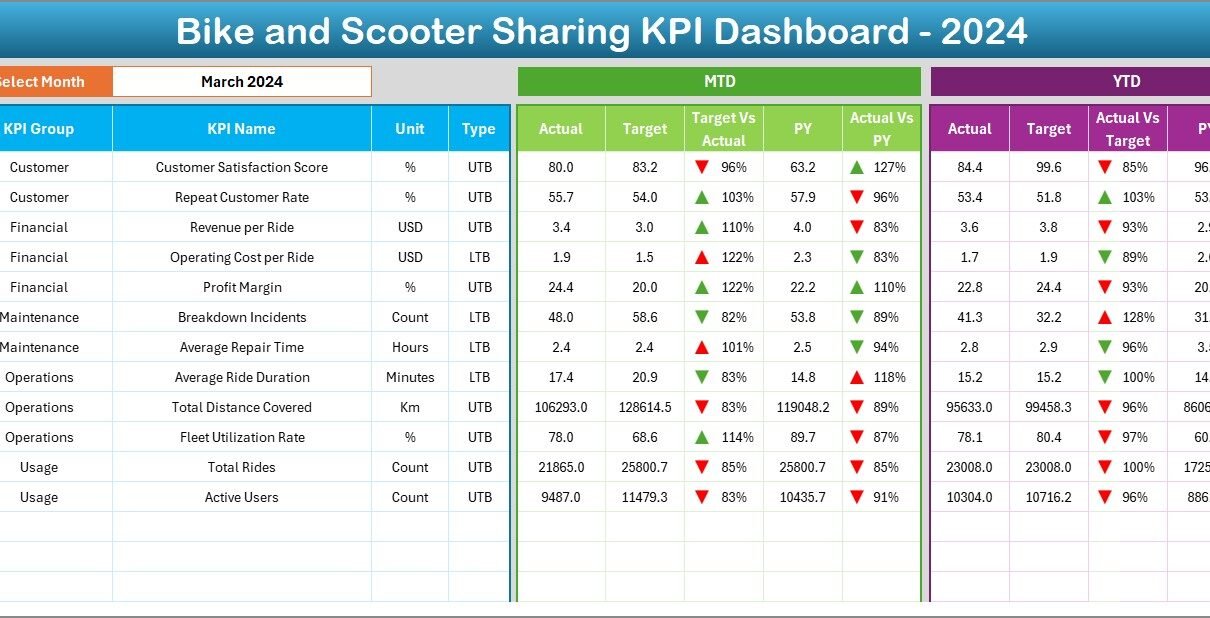
In today’s fast-growing urban mobility market, bike and scooter sharing services have become a vital part of modern transportation. With thousands of users, multiple docking stations, and daily rental transactions,