New: NextGenTemplates Academy - video courses on Excel formulas with AI and Pivot Tables & dashboards. Early-bird: 20% off with code EARLYBIRD20 - first 20 orders only. See the courses →
  • Learn Excel (Free Course)
    • 1. Shortcut Keys
    • 2. Fill & Flash Fill
    • 3. Find & Replace
    • 4. Sort & Filter
    • 5. Formulas & Functions
    • 6. Data Validation
    • 7. Conditional Formatting
    • 8. Basic Charts
    • 9. Advanced Charts
    • 10. Pivot Tables
    • 11. Excel Dashboards
    • 12. VBA Course
    • 13. Excel Formulas with AI
  • Templates
  • Tutorials
    • Charts and Visualization
    • VBA
    • Excel Tips and Tricks
    • Excel Dashboards
    • Power Pivot & DAX
  • Power BI
  • Template Store
    • Ready to Use Templates
  • Courses
  • Academy
    • Excel + AI Mastery: 100 Formulas
    • Excel Pivot Tables & Dashboards
  • About Us
  • Contact Us

PK: An Excel Expert

Transforming Data into Decisions

Tag: Social Impact Analytics

Dashboard Power BI

Civic Engagement Platforms Dashboard in Power BI

March 27, 2026March 27, 2026 PKComments Off on Civic Engagement Platforms Dashboard in Power BI
In today’s digital world, civic engagement platforms play a vital role in connecting communities, managing campaigns, and driving meaningful social impact. However, managing large volumes of data across campaigns, regions,
Read More
Dashboard

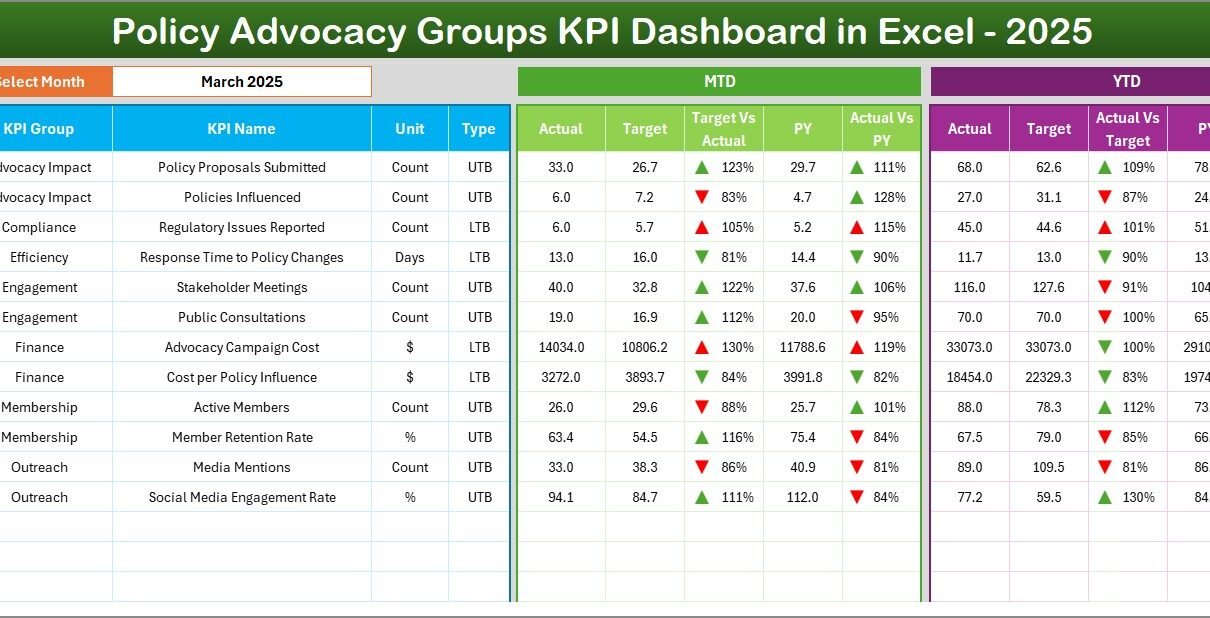
Policy Advocacy Groups KPI Dashboard in Excel

February 11, 2026February 11, 2026 PKComments Off on Policy Advocacy Groups KPI Dashboard in Excel
Policy advocacy groups work hard to influence change. They organize campaigns, engage stakeholders, conduct research, and mobilize communities. However, many organizations still track performance using scattered spreadsheets. As a result,
Read More
Dashboard Power BI

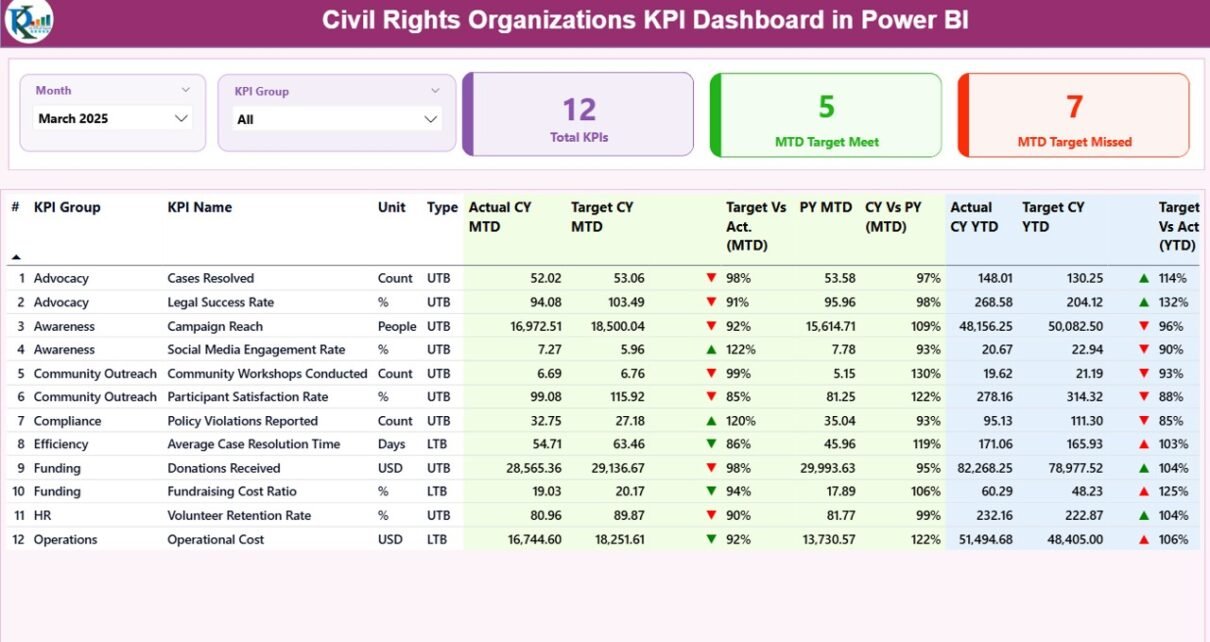
Civil Rights Organizations KPI Dashboard in Power BI

February 11, 2026February 11, 2026 PKComments Off on Civil Rights Organizations KPI Dashboard in Power BI
Civil rights organizations fight for justice, equality, and human dignity every single day. However, passion alone does not create measurable impact. Data creates impact. Clear reporting builds trust. Strong monitoring
Read More
Dashboard Power BI

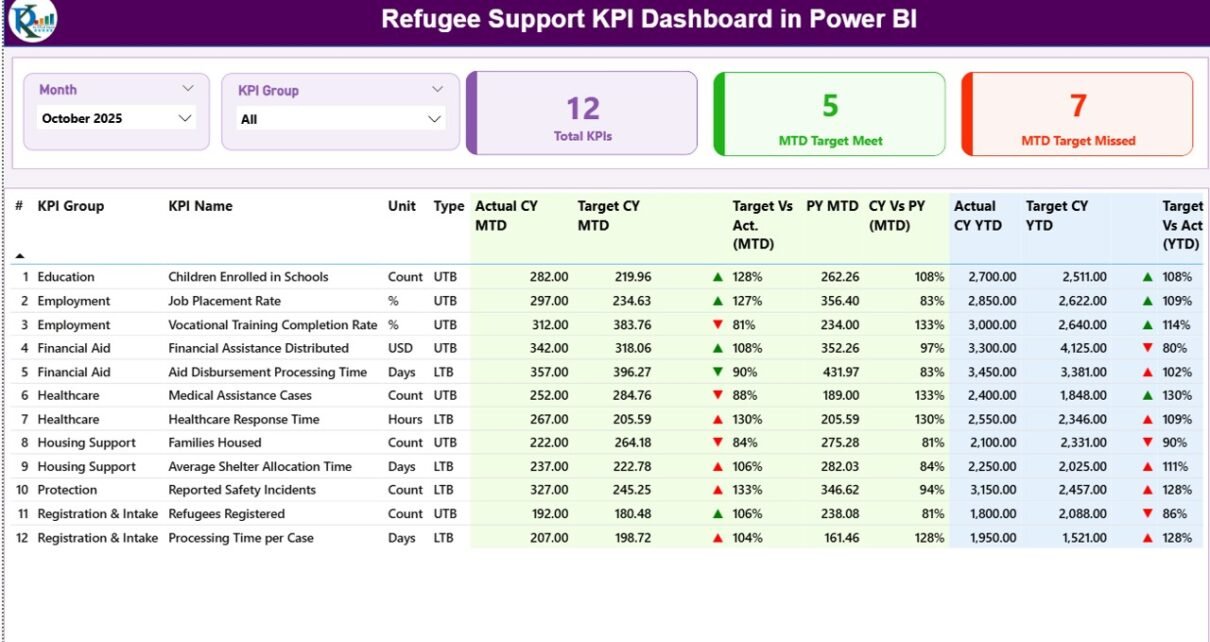
Refugee Support KPI Dashboard in Power BI

February 11, 2026February 11, 2026 PKComments Off on Refugee Support KPI Dashboard in Power BI
Humanitarian work demands clarity. Teams must track shelter support, food distribution, healthcare coverage, education access, and employment programs. However, when teams use scattered spreadsheets, they lose visibility. As a result,
Read More
  • Learn Excel (Free Course)
    • 1. Shortcut Keys
    • 2. Fill & Flash Fill
    • 3. Find & Replace
    • 4. Sort & Filter
    • 5. Formulas & Functions
    • 6. Data Validation
    • 7. Conditional Formatting
    • 8. Basic Charts
    • 9. Advanced Charts
    • 10. Pivot Tables
    • 11. Excel Dashboards
    • 12. VBA Course
    • 13. Excel Formulas with AI
  • Templates
  • Tutorials
    • Charts and Visualization
    • VBA
    • Excel Tips and Tricks
    • Excel Dashboards
    • Power Pivot & DAX
  • Power BI
  • Template Store
    • Ready to Use Templates
  • Courses
  • Academy
    • Excel + AI Mastery: 100 Formulas
    • Excel Pivot Tables & Dashboards
  • About Us
  • Contact Us
Copyright © 2023 PK-AnExcelExpert.com - Privacy Policy