New: NextGenTemplates Academy - video courses on Excel formulas with AI and Pivot Tables & dashboards. Early-bird: 20% off with code EARLYBIRD20 - first 20 orders only. See the courses →
  • Learn Excel (Free Course)
    • 1. Shortcut Keys
    • 2. Fill & Flash Fill
    • 3. Find & Replace
    • 4. Sort & Filter
    • 5. Formulas & Functions
    • 6. Data Validation
    • 7. Conditional Formatting
    • 8. Basic Charts
    • 9. Advanced Charts
    • 10. Pivot Tables
    • 11. Excel Dashboards
    • 12. VBA Course
    • 13. Excel Formulas with AI
  • Templates
  • Tutorials
    • Charts and Visualization
    • VBA
    • Excel Tips and Tricks
    • Excel Dashboards
    • Power Pivot & DAX
  • Power BI
  • Template Store
    • Ready to Use Templates
  • Courses
  • Academy
    • Excel + AI Mastery: 100 Formulas
    • Excel Pivot Tables & Dashboards
  • About Us
  • Contact Us

PK: An Excel Expert

Transforming Data into Decisions

Tag: supply chain performance

Dashboard Power BI

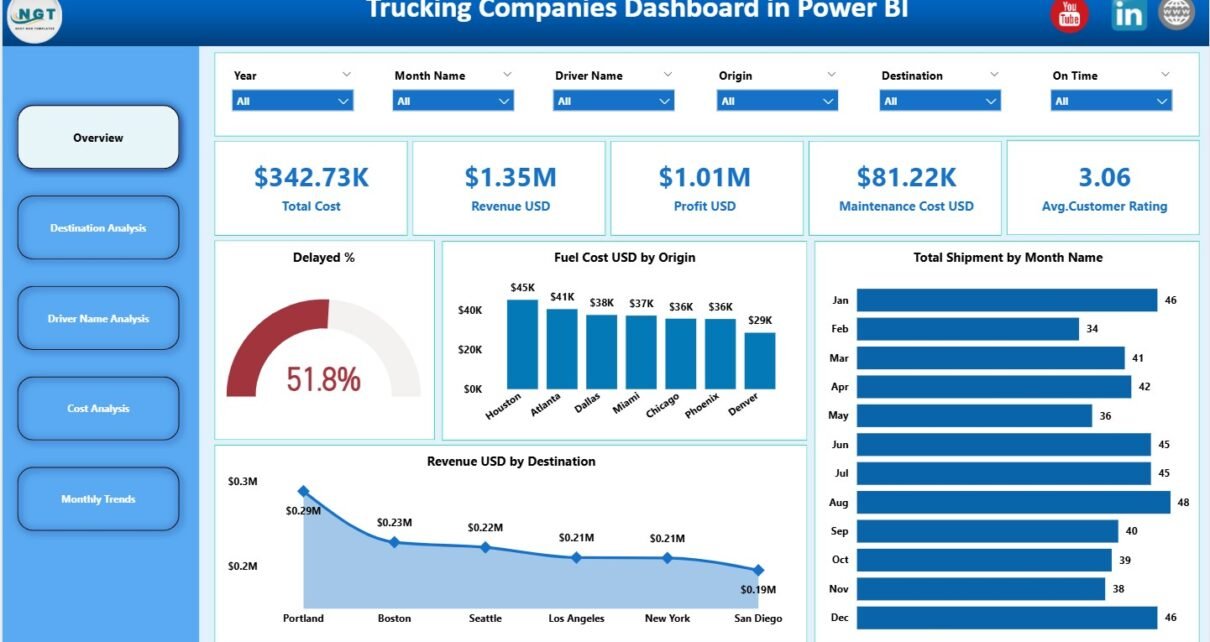
Trucking Companies Dashboard in Power BI

December 19, 2025December 19, 2025 PKComments Off on Trucking Companies Dashboard in Power BI
Trucking companies operate in a highly competitive and cost-sensitive environment. Fuel prices fluctuate, maintenance costs rise, delivery delays impact customer satisfaction, and profit margins remain under constant pressure. Therefore, trucking
Read More
Dashboard

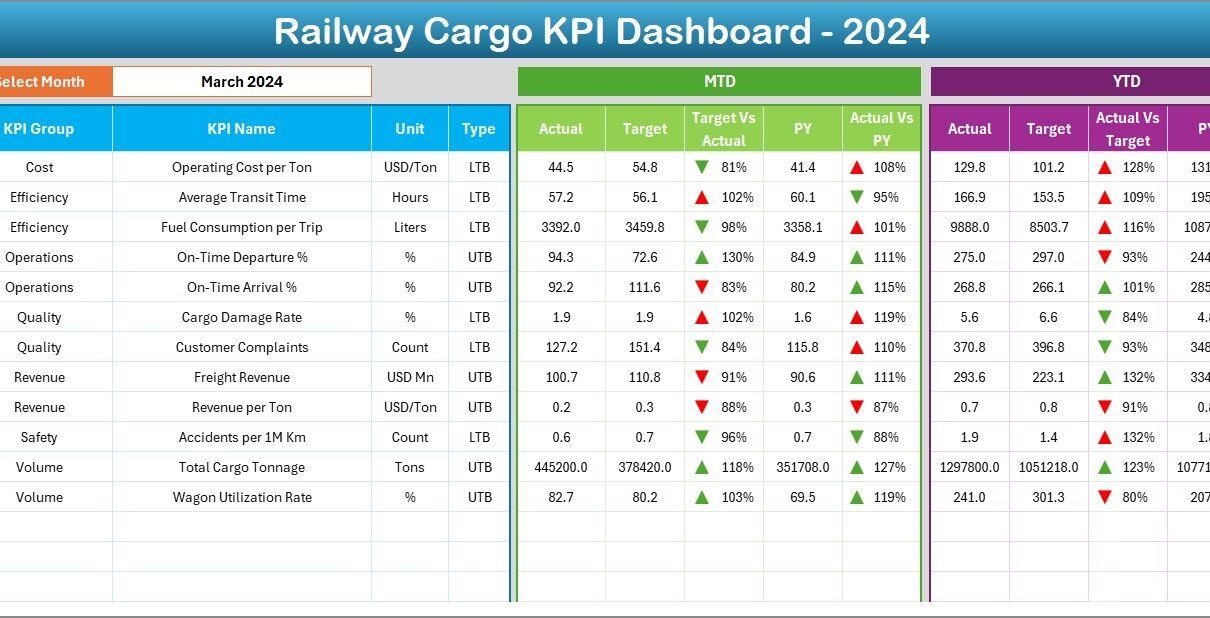
Railway Cargo KPI Dashboard in Excel

December 19, 2025December 19, 2025 PKComments Off on Railway Cargo KPI Dashboard in Excel
Railway cargo plays a vital role in national and international supply chains. From bulk commodities to containerized freight, railway cargo operations demand efficiency, accuracy, and timely decision-making. However, many railway
Read More
Dashboard Power BI

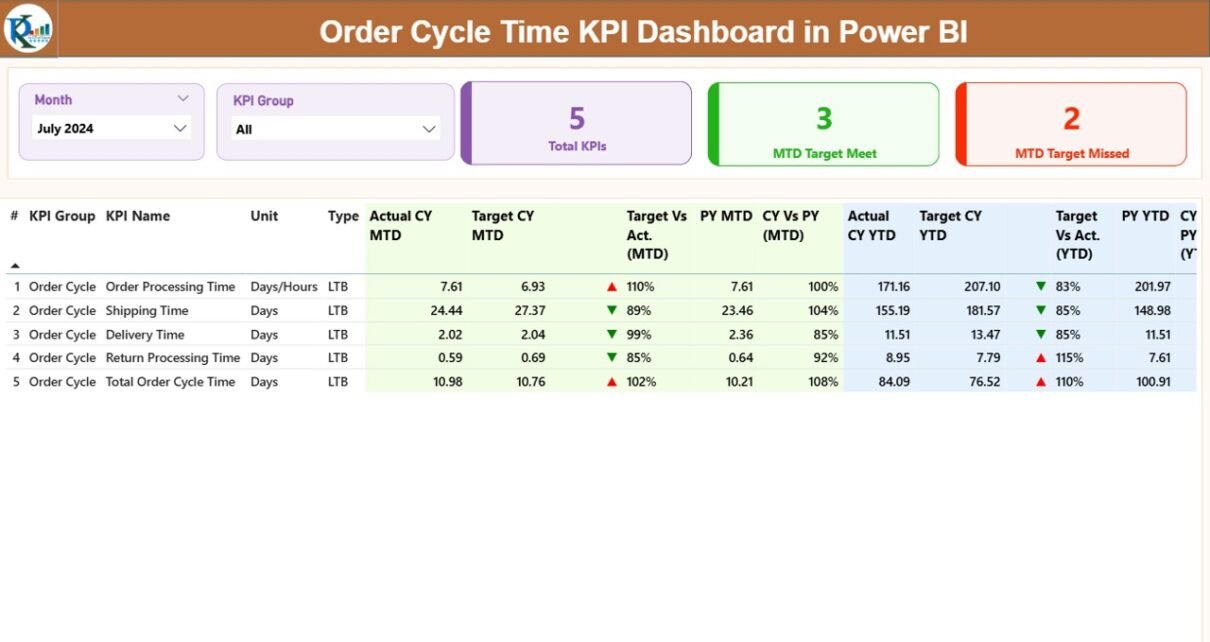
Order Cycle Time KPI Dashboard in Power BI

October 14, 2025October 14, 2025 PKComments Off on Order Cycle Time KPI Dashboard in Power BI
In today’s competitive business world, speed and efficiency are key drivers of customer satisfaction and profitability. One of the most critical performance metrics in supply chain and logistics operations is
Read More
Dashboard

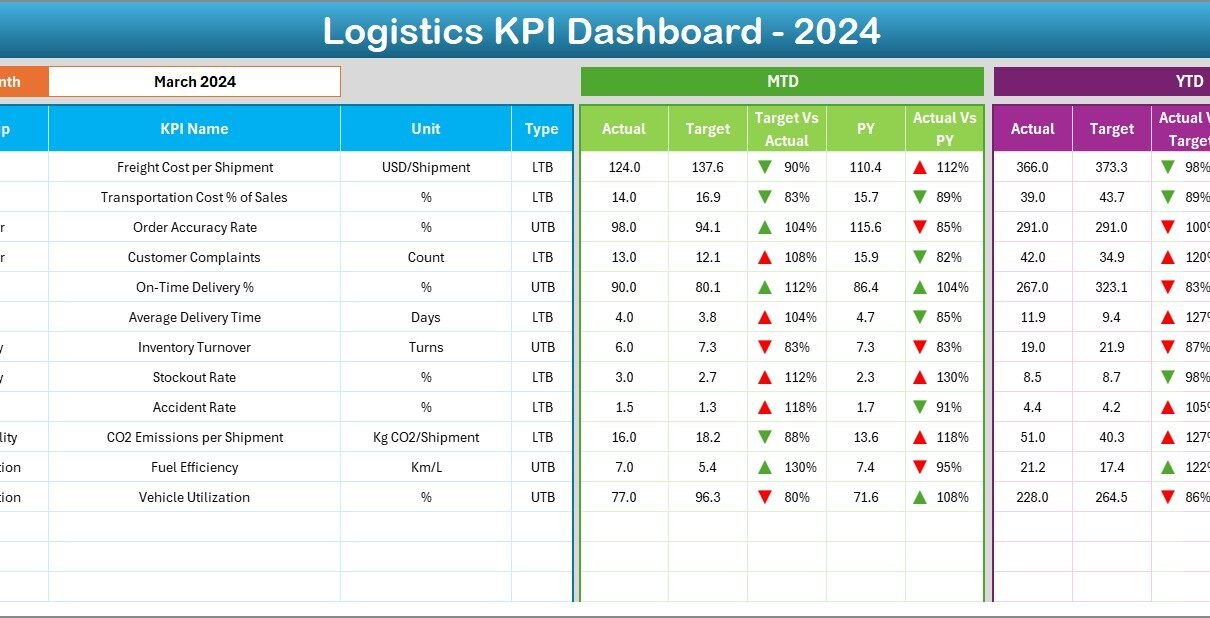
Logistics KPI Dashboard in Excel

September 12, 2025September 12, 2025 PKComments Off on Logistics KPI Dashboard in Excel
Managing logistics operations is a complex process. From inventory management to delivery timelines, businesses must monitor performance constantly to ensure cost efficiency and customer satisfaction. This is where a Logistics
Read More
Dashboard

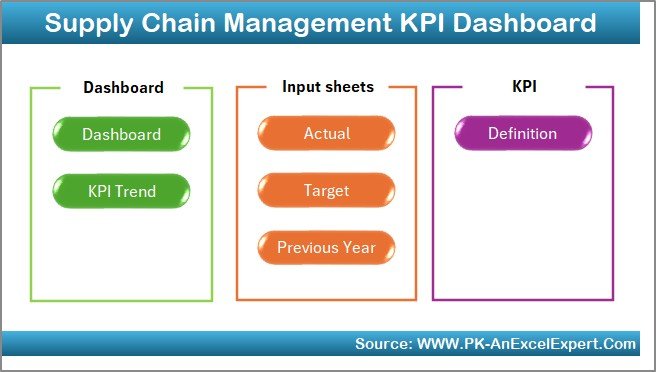
Supply Chain Management KPI Dashboard in Excel

September 6, 2025September 6, 2025 PKComments Off on Supply Chain Management KPI Dashboard in Excel
Supply chain management is one of the most critical areas for any business. From raw materials to customer delivery, every stage involves multiple processes, decisions, and stakeholders. Without clear visibility
Read More
Dashboard Power BI

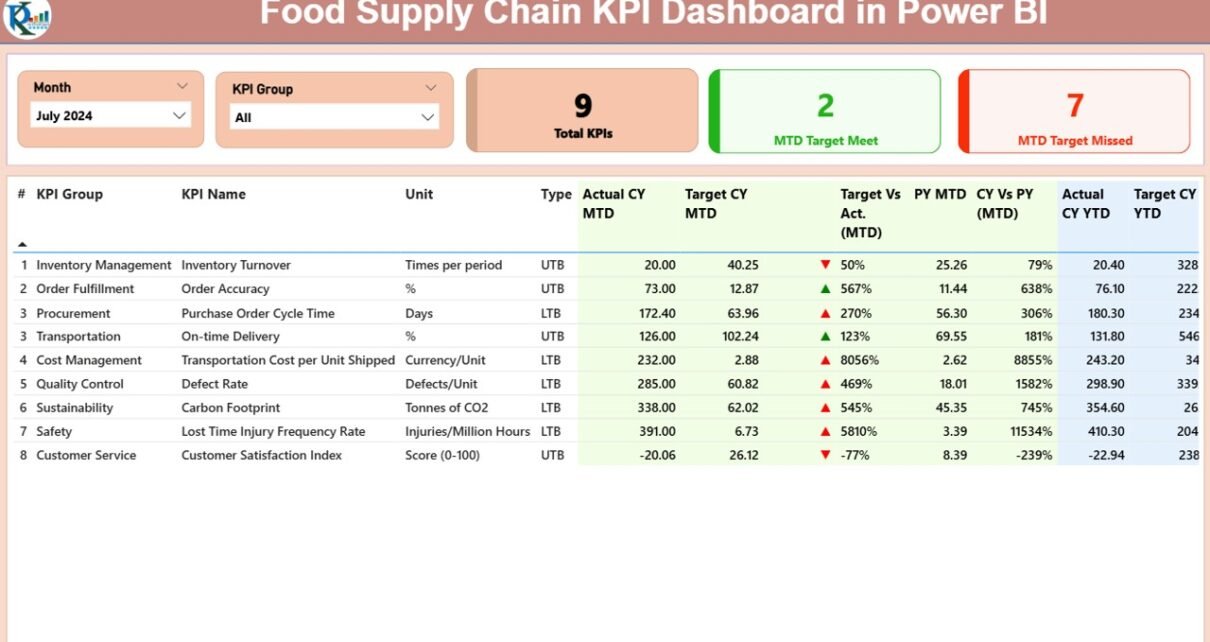
Food Supply Chain KPI Dashboard in Power BI

July 17, 2025July 17, 2025 PKComments Off on Food Supply Chain KPI Dashboard in Power BI
The food supply chain is a complex system, involving multiple stages from production to delivery. In today’s data-driven world, managing this process effectively requires clear insights into key performance indicators
Read More
  • Learn Excel (Free Course)
    • 1. Shortcut Keys
    • 2. Fill & Flash Fill
    • 3. Find & Replace
    • 4. Sort & Filter
    • 5. Formulas & Functions
    • 6. Data Validation
    • 7. Conditional Formatting
    • 8. Basic Charts
    • 9. Advanced Charts
    • 10. Pivot Tables
    • 11. Excel Dashboards
    • 12. VBA Course
    • 13. Excel Formulas with AI
  • Templates
  • Tutorials
    • Charts and Visualization
    • VBA
    • Excel Tips and Tricks
    • Excel Dashboards
    • Power Pivot & DAX
  • Power BI
  • Template Store
    • Ready to Use Templates
  • Courses
  • Academy
    • Excel + AI Mastery: 100 Formulas
    • Excel Pivot Tables & Dashboards
  • About Us
  • Contact Us
Copyright © 2023 PK-AnExcelExpert.com - Privacy Policy