New: NextGenTemplates Academy - video courses on Excel formulas with AI and Pivot Tables & dashboards. Early-bird: 20% off with code EARLYBIRD20 - first 20 orders only. See the courses →
  • Learn Excel (Free Course)
    • 1. Shortcut Keys
    • 2. Fill & Flash Fill
    • 3. Find & Replace
    • 4. Sort & Filter
    • 5. Formulas & Functions
    • 6. Data Validation
    • 7. Conditional Formatting
    • 8. Basic Charts
    • 9. Advanced Charts
    • 10. Pivot Tables
    • 11. Excel Dashboards
    • 12. VBA Course
    • 13. Excel Formulas with AI
  • Templates
  • Tutorials
    • Charts and Visualization
    • VBA
    • Excel Tips and Tricks
    • Excel Dashboards
    • Power Pivot & DAX
  • Power BI
  • Template Store
    • Ready to Use Templates
  • Courses
  • Academy
    • Excel + AI Mastery: 100 Formulas
    • Excel Pivot Tables & Dashboards
  • About Us
  • Contact Us

PK: An Excel Expert

Transforming Data into Decisions

Tag: Sustainability Dashboard

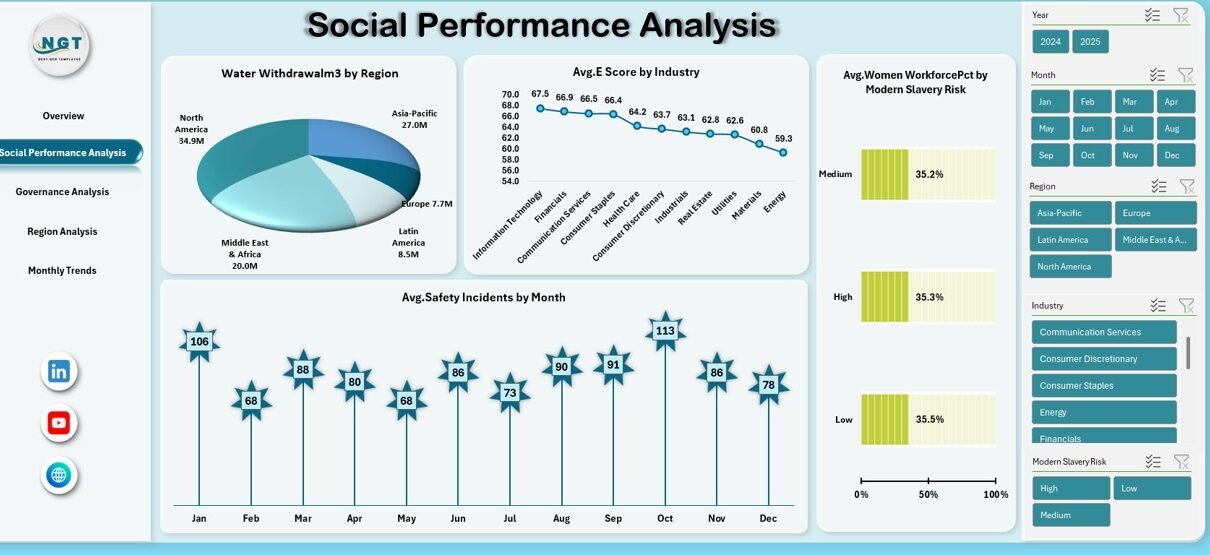
Dashboard Power BI

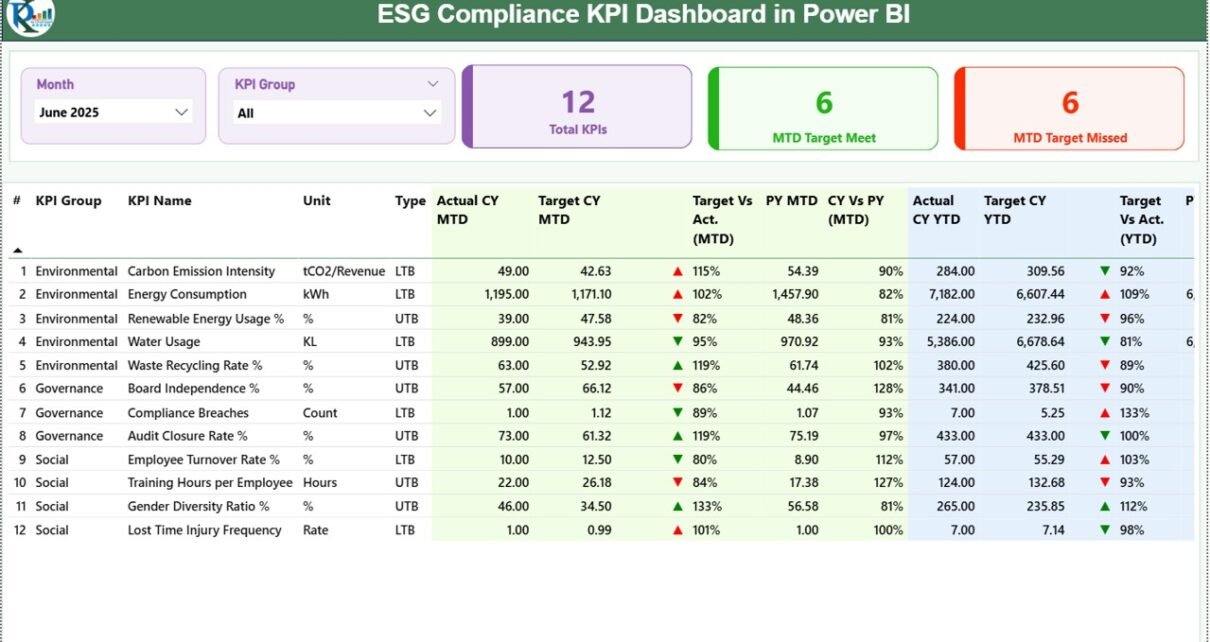
ESG Compliance KPI Dashboard in Power BI

January 26, 2026January 26, 2026 PKComments Off on ESG Compliance KPI Dashboard in Power BI
Environmental, Social, and Governance (ESG) compliance has become a critical focus area for organizations worldwide. Regulators demand transparency, investors expect accountability, and customers prefer responsible businesses. However, many organizations still
Read More
Dashboard

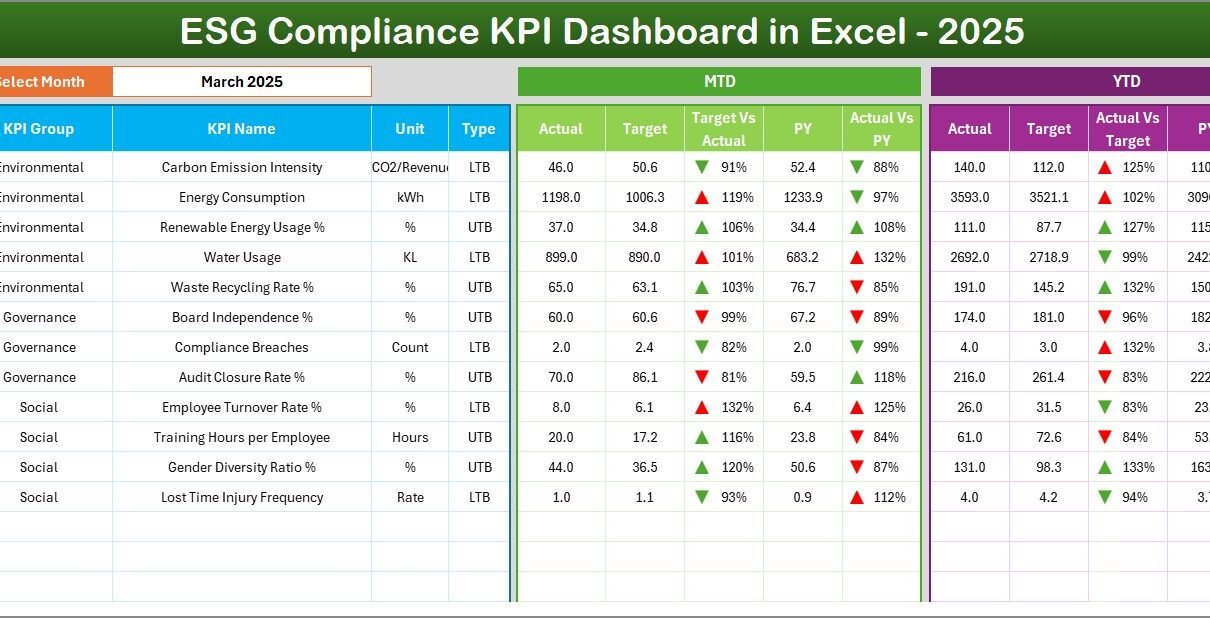
ESG Compliance KPI Dashboard in Excel

January 26, 2026January 26, 2026 PKComments Off on ESG Compliance KPI Dashboard in Excel
Environmental, Social, and Governance (ESG) compliance has become a top priority for organizations across industries. Regulators, investors, customers, and internal stakeholders now expect transparent, measurable, and consistent ESG reporting. However,
Read More
Dashboard

Environmental, Social, and Governance (ESG) Dashboard in Excel

January 16, 2026January 16, 2026 PKComments Off on Environmental, Social, and Governance (ESG) Dashboard in Excel
Environmental, Social, and Governance (ESG) reporting has moved from a “nice to have” to a business necessity. Today, investors, regulators, customers, and employees expect transparency, accountability, and measurable impact. As
Read More
Dashboard Power BI

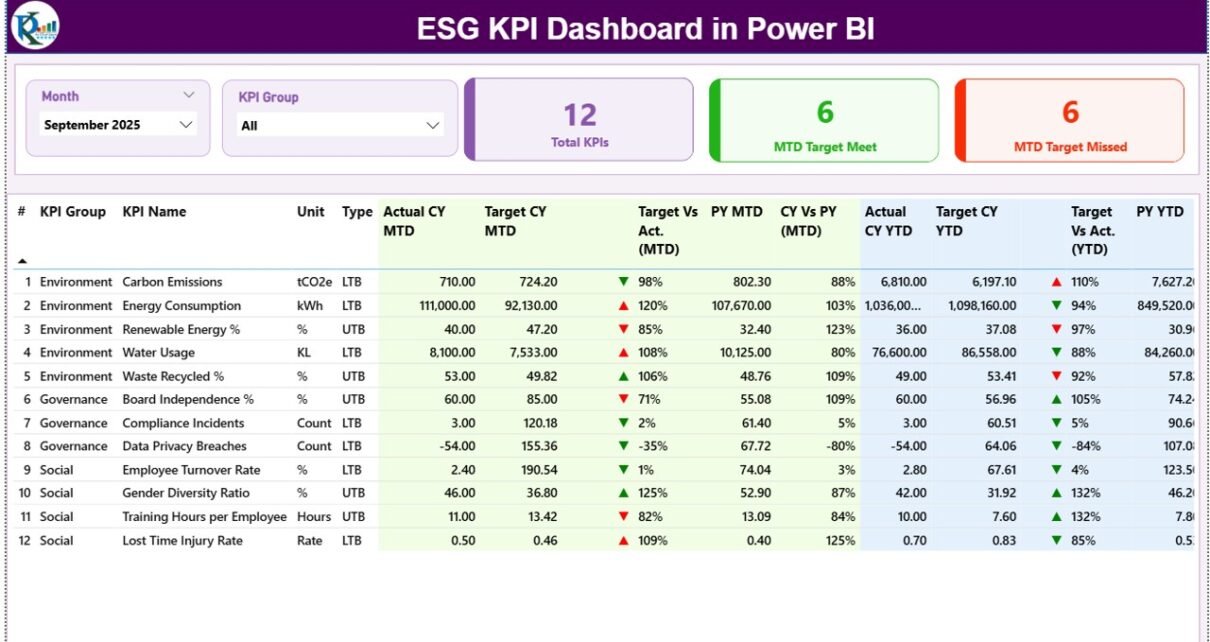
ESG KPI Dashboard in Power BI

January 15, 2026January 15, 2026 PKComments Off on ESG KPI Dashboard in Power BI
In today’s business environment, organizations must track Environmental, Social, and Governance (ESG) performance with the same seriousness as financial results. Investors, regulators, customers, and internal leaders expect clear, measurable, and
Read More
Dashboard

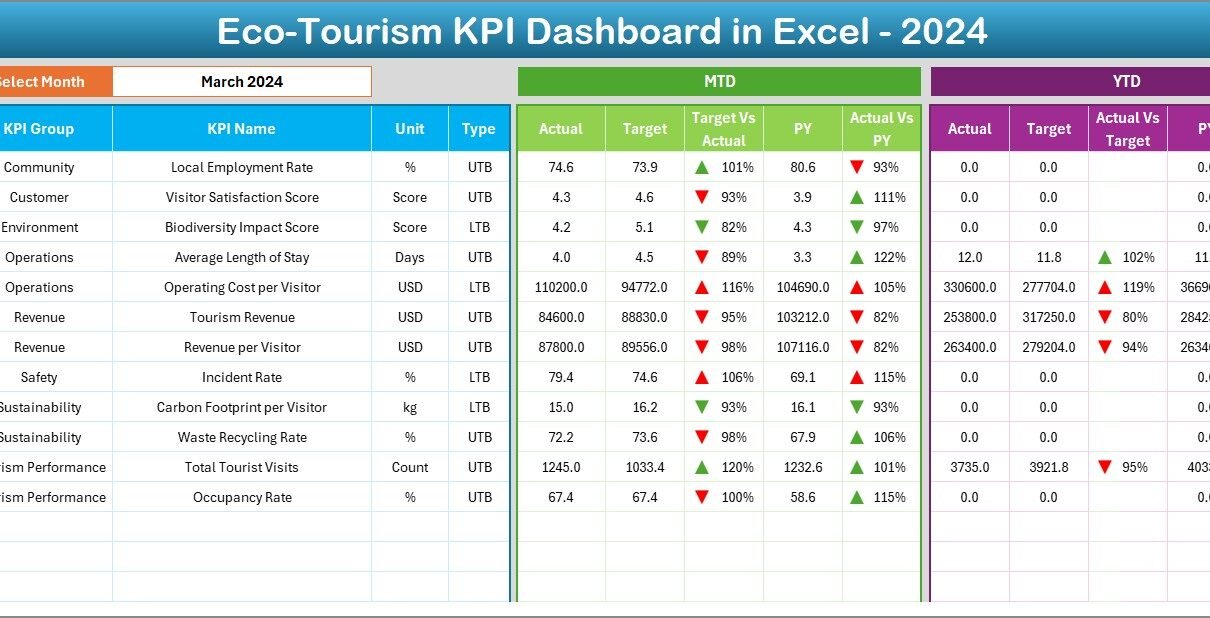
Eco-Tourism KPI Dashboard in Excel

January 12, 2026January 12, 2026 PKComments Off on Eco-Tourism KPI Dashboard in Excel
Managing eco-tourism operations requires responsibility, transparency, and constant performance tracking. However, many eco-tourism operators still depend on scattered Excel sheets, manual reports, and delayed summaries. As a result, they struggle
Read More
Dashboard Power BI

Water Harvesting KPI Dashboard in Power BI

January 9, 2026January 9, 2026 PKComments Off on Water Harvesting KPI Dashboard in Power BI
Water scarcity continues to grow as a global challenge. Therefore, organizations, governments, municipalities, and sustainability teams must monitor water harvesting performance more closely than ever. However, when data remains scattered
Read More
Dashboard Power BI

Biofuels KPI Dashboard in Power BI

January 6, 2026January 6, 2026 PKComments Off on Biofuels KPI Dashboard in Power BI
The biofuels industry plays a vital role in the global shift toward clean and renewable energy. However, as operations grow, tracking performance, meeting targets, and comparing results across months and
Read More
Dashboard Power BI

Renewable Resource KPI Dashboard Power BI

January 3, 2026January 3, 2026 PKComments Off on Renewable Resource KPI Dashboard Power BI
Managing renewable resources is no longer optional. Today, organizations must track performance, meet sustainability targets, and report progress with clarity. However, many teams still rely on scattered Excel files, delayed
Read More
Dashboard Power BI

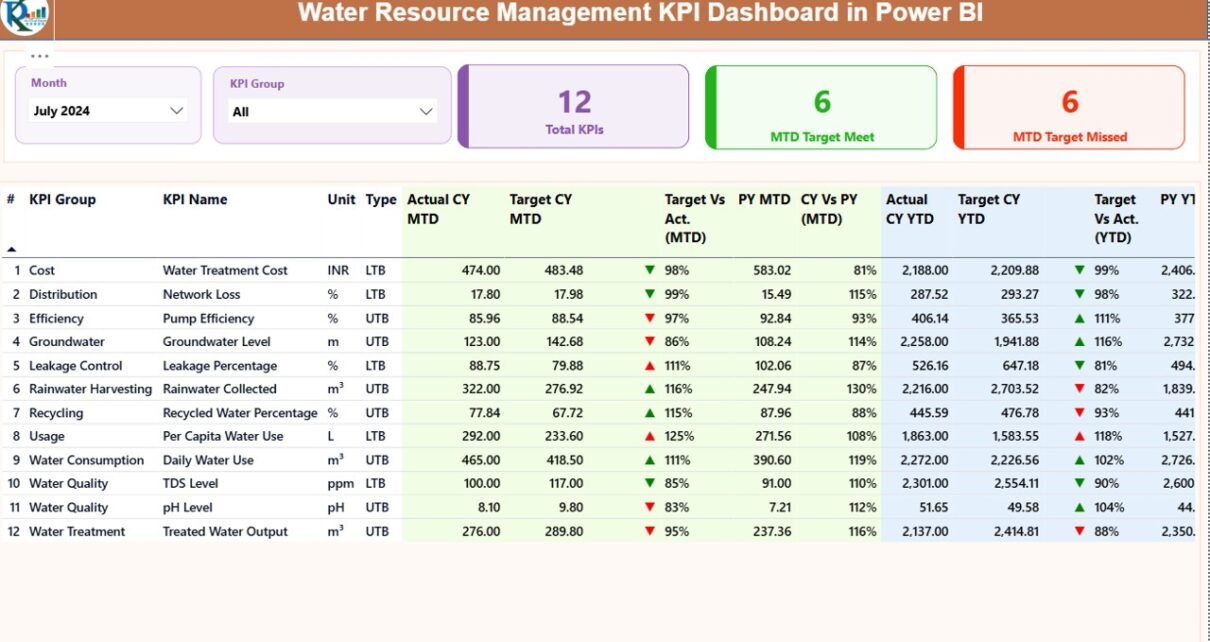
Water Resource Management KPI Dashboard in Power BI

December 16, 2025December 16, 2025 PKComments Off on Water Resource Management KPI Dashboard in Power BI
Water resource management plays a critical role in sustainability, operational efficiency, and regulatory compliance. However, many organizations still track water usage, losses, efficiency, and targets using scattered Excel files or
Read More
Dashboard Power BI

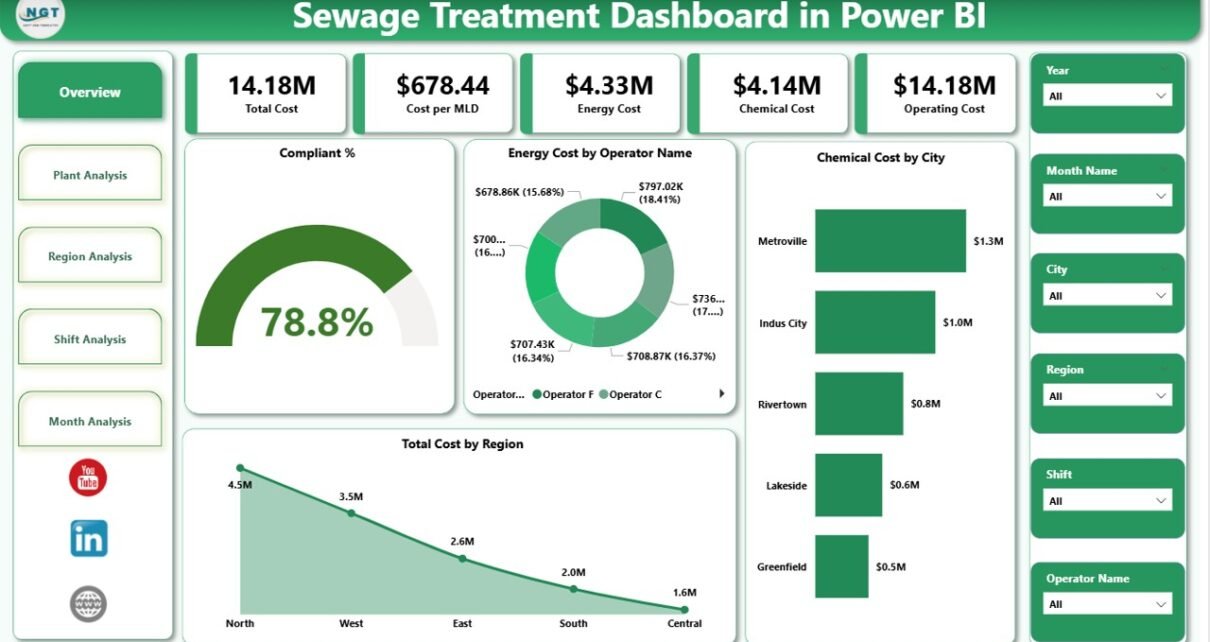
Sewage Treatment Dashboard in Power BI

December 14, 2025December 14, 2025 PKComments Off on Sewage Treatment Dashboard in Power BI
Managing sewage treatment operations requires accuracy, transparency, and continuous monitoring. However, many organizations still depend on manual reports, scattered Excel sheets, and delayed data updates. As a result, decision-making becomes
Read More

Posts pagination

Previous 1 2 3 4 Next
  • Learn Excel (Free Course)
    • 1. Shortcut Keys
    • 2. Fill & Flash Fill
    • 3. Find & Replace
    • 4. Sort & Filter
    • 5. Formulas & Functions
    • 6. Data Validation
    • 7. Conditional Formatting
    • 8. Basic Charts
    • 9. Advanced Charts
    • 10. Pivot Tables
    • 11. Excel Dashboards
    • 12. VBA Course
    • 13. Excel Formulas with AI
  • Templates
  • Tutorials
    • Charts and Visualization
    • VBA
    • Excel Tips and Tricks
    • Excel Dashboards
    • Power Pivot & DAX
  • Power BI
  • Template Store
    • Ready to Use Templates
  • Courses
  • Academy
    • Excel + AI Mastery: 100 Formulas
    • Excel Pivot Tables & Dashboards
  • About Us
  • Contact Us
Copyright © 2023 PK-AnExcelExpert.com - Privacy Policy