New: NextGenTemplates Academy - video courses on Excel formulas with AI and Pivot Tables & dashboards. Early-bird: 20% off with code EARLYBIRD20 - first 20 orders only. See the courses →
  • Learn Excel (Free Course)
    • 1. Shortcut Keys
    • 2. Fill & Flash Fill
    • 3. Find & Replace
    • 4. Sort & Filter
    • 5. Formulas & Functions
    • 6. Data Validation
    • 7. Conditional Formatting
    • 8. Basic Charts
    • 9. Advanced Charts
    • 10. Pivot Tables
    • 11. Excel Dashboards
    • 12. VBA Course
    • 13. Excel Formulas with AI
  • Templates
  • Tutorials
    • Charts and Visualization
    • VBA
    • Excel Tips and Tricks
    • Excel Dashboards
    • Power Pivot & DAX
  • Power BI
  • Template Store
    • Ready to Use Templates
  • Courses
  • Academy
    • Excel + AI Mastery: 100 Formulas
    • Excel Pivot Tables & Dashboards
  • About Us
  • Contact Us

PK: An Excel Expert

Transforming Data into Decisions

Tag: target vs actual analysis

Dashboard Power BI

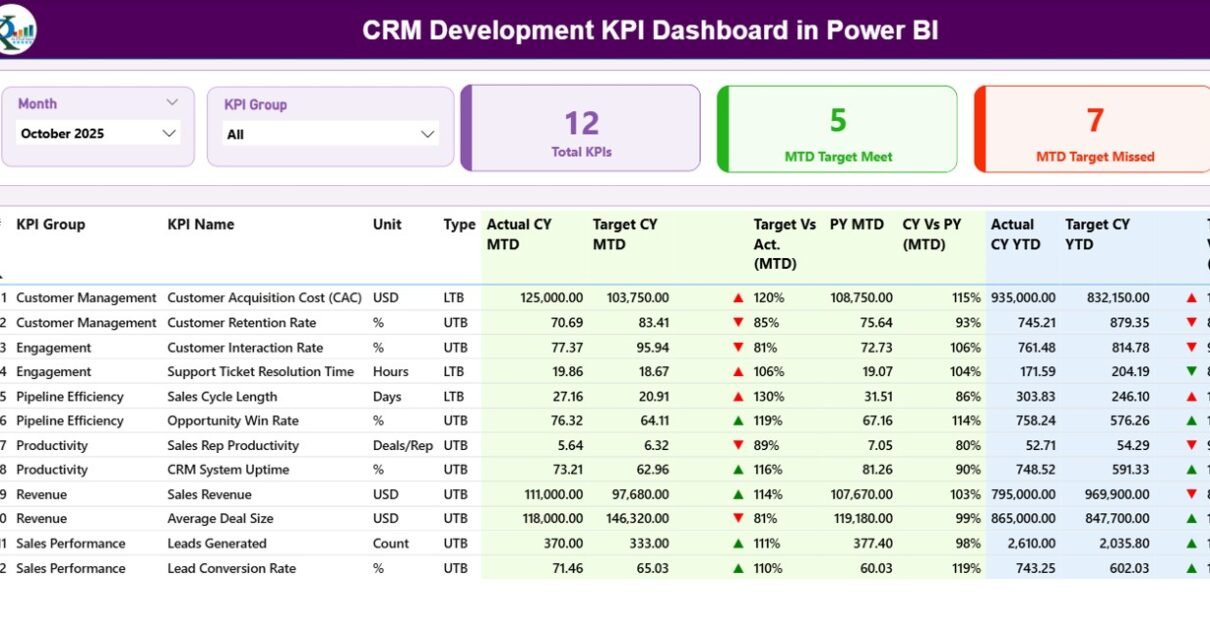
CRM Development KPI Dashboard in Power BI

February 17, 2026February 17, 2026 PKComments Off on CRM Development KPI Dashboard in Power BI
In today’s competitive business world, CRM development teams must track performance clearly and consistently. However, many teams still depend on scattered Excel sheets and manual reports. As a result, leaders
Read More
Dashboard

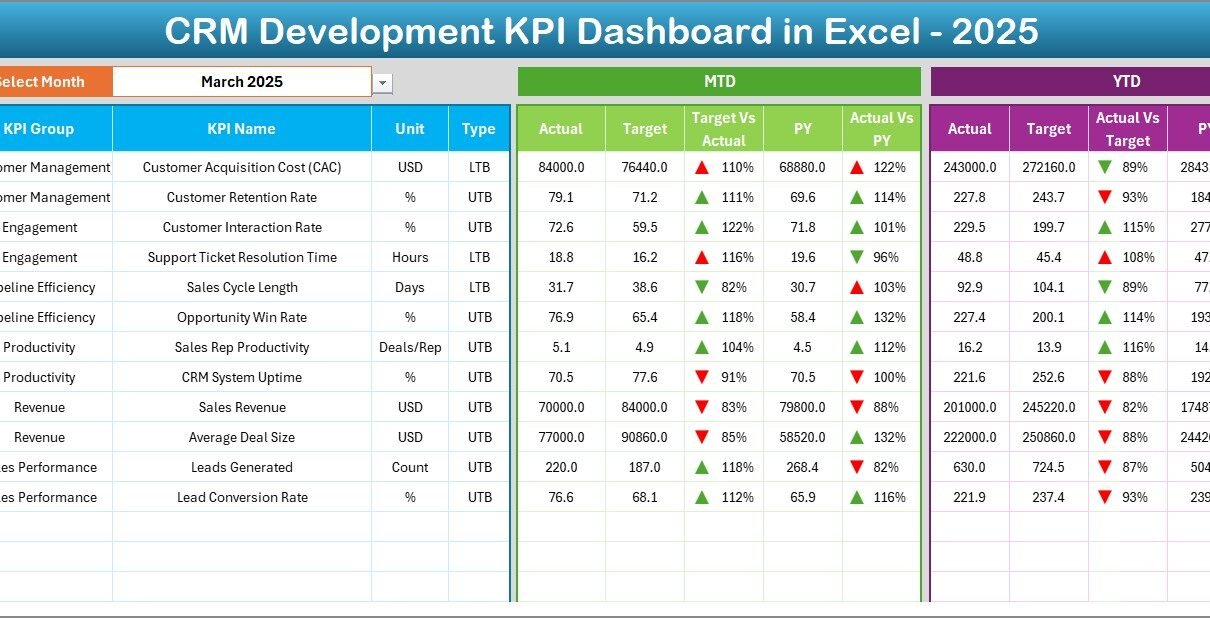
CRM Development KPI Dashboard in Excel

February 17, 2026February 17, 2026 PKComments Off on CRM Development KPI Dashboard in Excel
Customer relationships drive modern business growth. However, CRM development teams often struggle to measure performance clearly. They manage multiple metrics, track targets, monitor customer data, and report to management. Still,
Read More
Dashboard

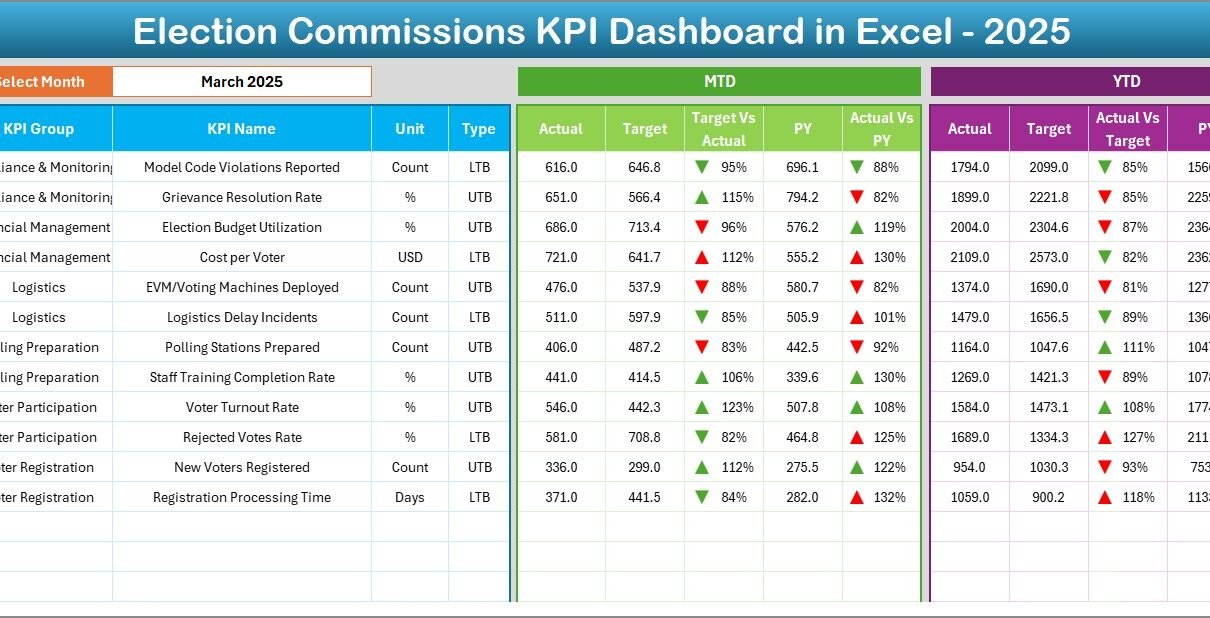
Election Commissions KPI Dashboard in Excel

February 13, 2026February 13, 2026 PKComments Off on Election Commissions KPI Dashboard in Excel
Election management demands accuracy, transparency, and real-time monitoring. However, many election offices still rely on scattered sheets and manual reports. As a result, leaders struggle to track voter turnout, polling
Read More
Dashboard

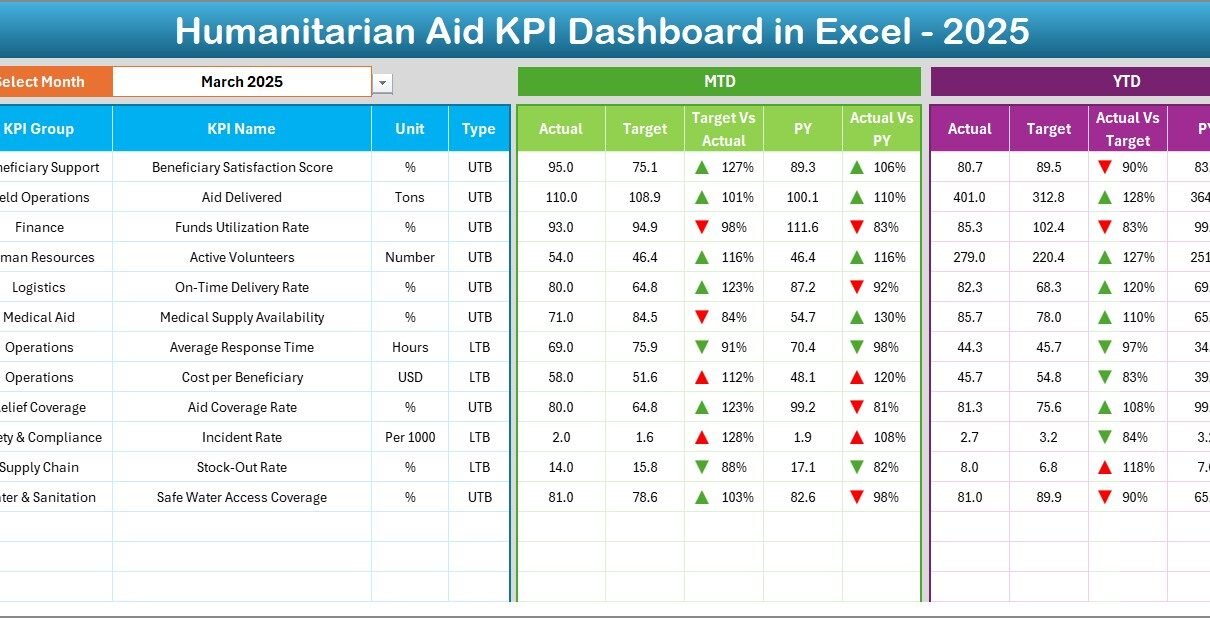
Humanitarian Aid KPI Dashboard in Excel

February 12, 2026February 12, 2026 PKComments Off on Humanitarian Aid KPI Dashboard in Excel
Humanitarian organizations operate in complex and high-pressure environments. They deliver food, medical support, shelter, education, and emergency relief across regions. However, without proper tracking, leaders struggle to measure impact clearly.
Read More
Dashboard Power BI

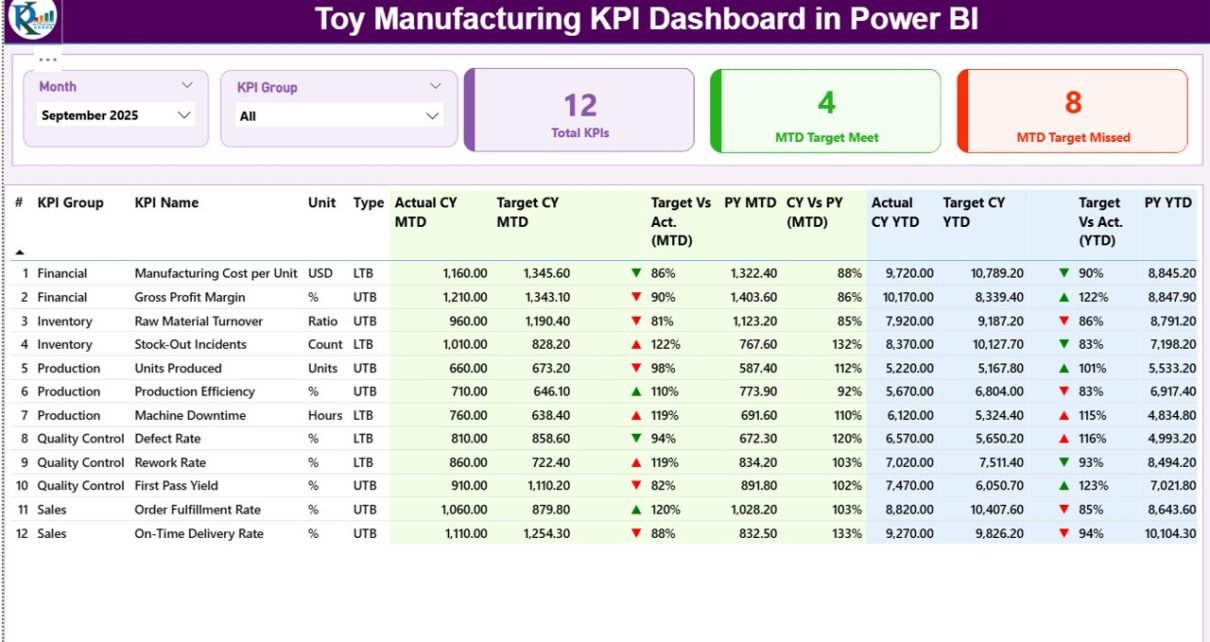
Toy Manufacturing KPI Dashboard in Power BI

February 7, 2026February 7, 2026 PKComments Off on Toy Manufacturing KPI Dashboard in Power BI
The toy industry moves fast. Trends change quickly. Seasonal demand rises sharply. Retail pressure increases daily. Therefore, toy manufacturers must track production, quality, sales, and delivery metrics in real time.
Read More
Dashboard Power BI

Microfinance Institutions KPI Dashboard in Power BI

January 10, 2026January 10, 2026 PKComments Off on Microfinance Institutions KPI Dashboard in Power BI
In today’s fast-changing financial landscape, microfinance institutions (MFIs) must track performance with speed, clarity, and confidence. However, manual reports, scattered Excel files, and delayed insights slow down decisions. Therefore, MFIs
Read More
Dashboard Power BI

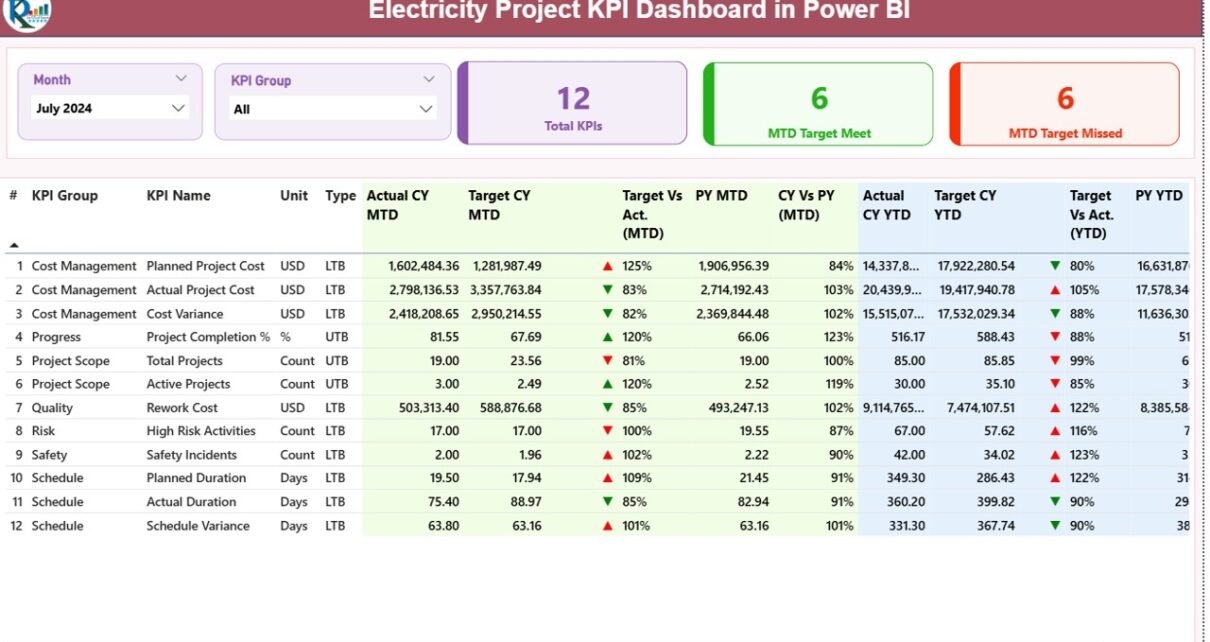
Electricity Project KPI Dashboard in Power BI

December 27, 2025December 27, 2025 PKComments Off on Electricity Project KPI Dashboard in Power BI
Managing electricity projects without clear performance visibility creates serious risks. Electricity projects involve high capital investment, strict timelines, regulatory compliance, and multiple stakeholders. Therefore, even a small deviation in performance
Read More
Dashboard Power BI

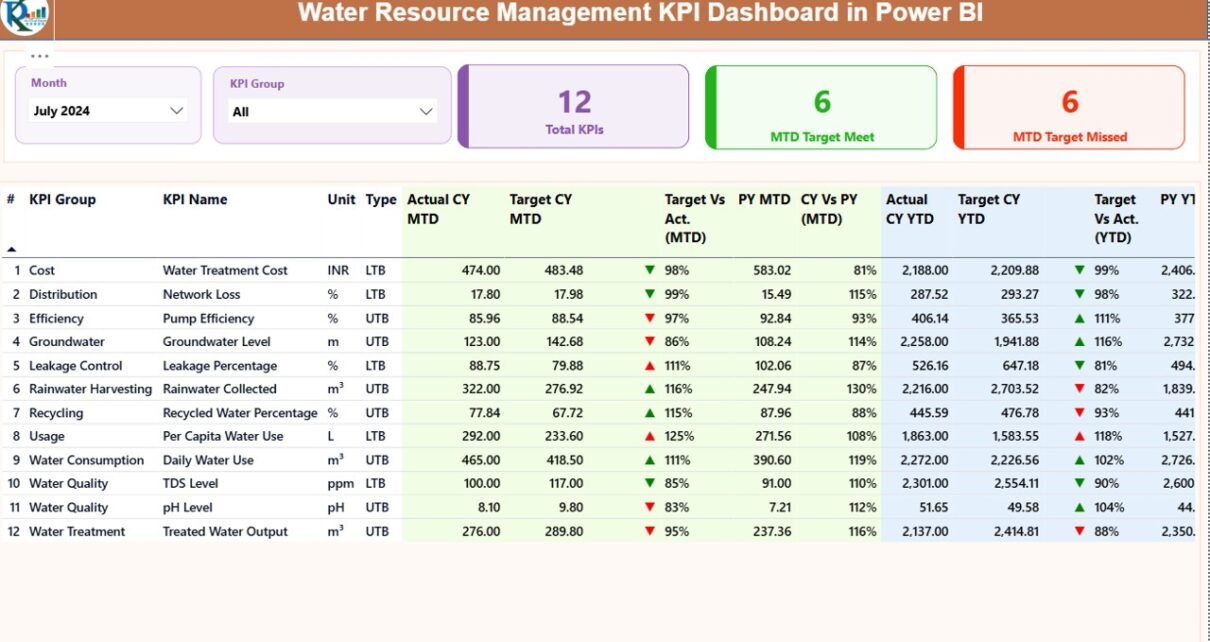
Water Resource Management KPI Dashboard in Power BI

December 16, 2025December 16, 2025 PKComments Off on Water Resource Management KPI Dashboard in Power BI
Water resource management plays a critical role in sustainability, operational efficiency, and regulatory compliance. However, many organizations still track water usage, losses, efficiency, and targets using scattered Excel files or
Read More
Dashboard Power BI

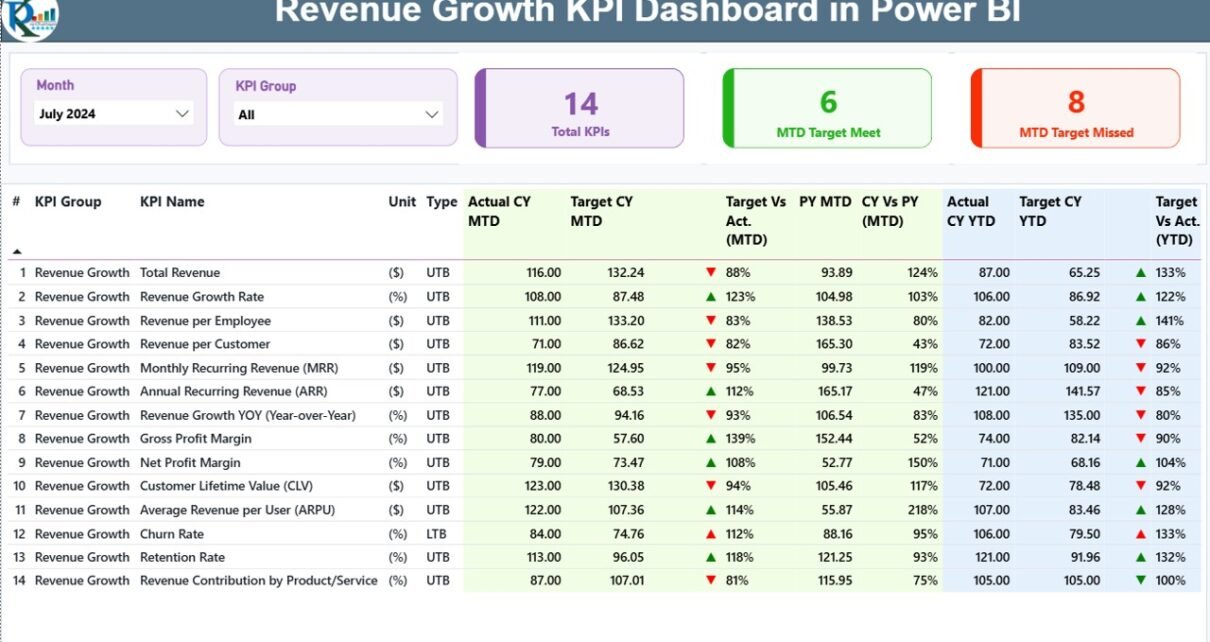
Revenue Growth KPI Dashboard in Power BI

December 3, 2025December 3, 2025 PKComments Off on Revenue Growth KPI Dashboard in Power BI
Businesses need fast and clear insights to grow their revenue. Sales change every month, new products enter the market, customer behaviour shifts often, and marketing teams run many campaigns. Because
Read More
Templates

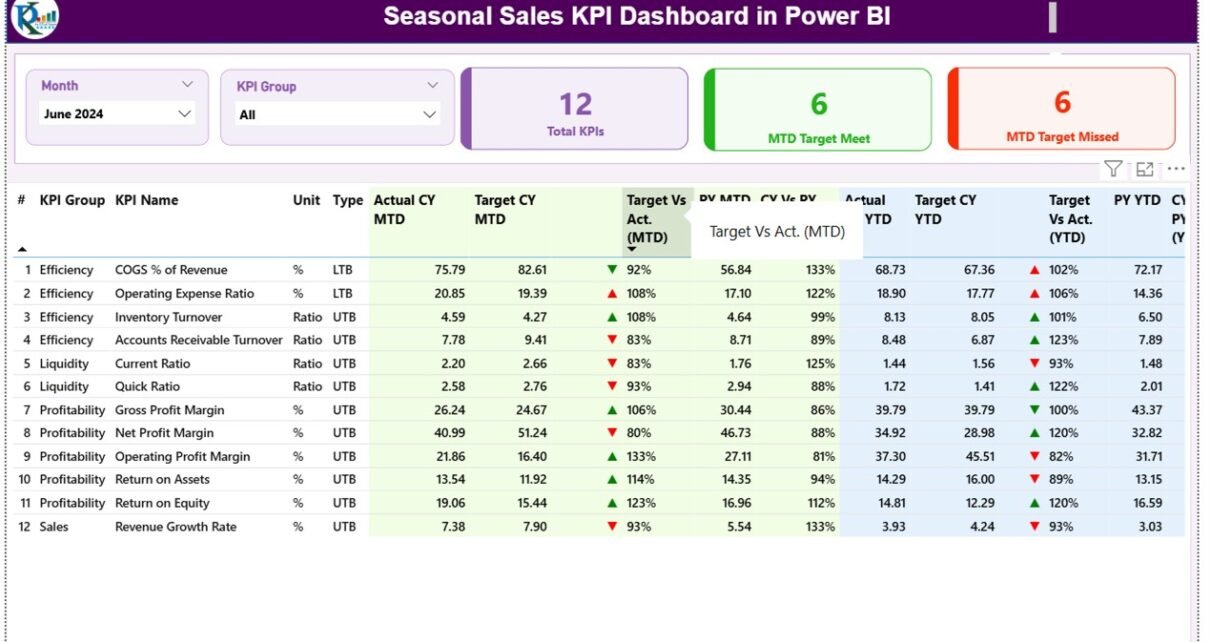
Seasonal Sales KPI Dashboard in Power BI

October 26, 2025October 26, 2025 PKComments Off on Seasonal Sales KPI Dashboard in Power BI
Seasonal sales play a vital role in every business that experiences demand fluctuations throughout the year. Whether it’s holiday shopping, summer tourism, or back-to-school retail, understanding these seasonal trends helps
Read More

Posts pagination

1 2 Next
  • Learn Excel (Free Course)
    • 1. Shortcut Keys
    • 2. Fill & Flash Fill
    • 3. Find & Replace
    • 4. Sort & Filter
    • 5. Formulas & Functions
    • 6. Data Validation
    • 7. Conditional Formatting
    • 8. Basic Charts
    • 9. Advanced Charts
    • 10. Pivot Tables
    • 11. Excel Dashboards
    • 12. VBA Course
    • 13. Excel Formulas with AI
  • Templates
  • Tutorials
    • Charts and Visualization
    • VBA
    • Excel Tips and Tricks
    • Excel Dashboards
    • Power Pivot & DAX
  • Power BI
  • Template Store
    • Ready to Use Templates
  • Courses
  • Academy
    • Excel + AI Mastery: 100 Formulas
    • Excel Pivot Tables & Dashboards
  • About Us
  • Contact Us
Copyright © 2023 PK-AnExcelExpert.com - Privacy Policy