New: NextGenTemplates Academy - video courses on Excel formulas with AI and Pivot Tables & dashboards. Early-bird: 20% off with code EARLYBIRD20 - first 20 orders only. See the courses →
  • Learn Excel (Free Course)
    • 1. Shortcut Keys
    • 2. Fill & Flash Fill
    • 3. Find & Replace
    • 4. Sort & Filter
    • 5. Formulas & Functions
    • 6. Data Validation
    • 7. Conditional Formatting
    • 8. Basic Charts
    • 9. Advanced Charts
    • 10. Pivot Tables
    • 11. Excel Dashboards
    • 12. VBA Course
    • 13. Excel Formulas with AI
  • Templates
  • Tutorials
    • Charts and Visualization
    • VBA
    • Excel Tips and Tricks
    • Excel Dashboards
    • Power Pivot & DAX
  • Power BI
  • Template Store
    • Ready to Use Templates
  • Courses
  • Academy
    • Excel + AI Mastery: 100 Formulas
    • Excel Pivot Tables & Dashboards
  • About Us
  • Contact Us

PK: An Excel Expert

Transforming Data into Decisions

Tag: Target vs Actual KPIs

Dashboard Power BI

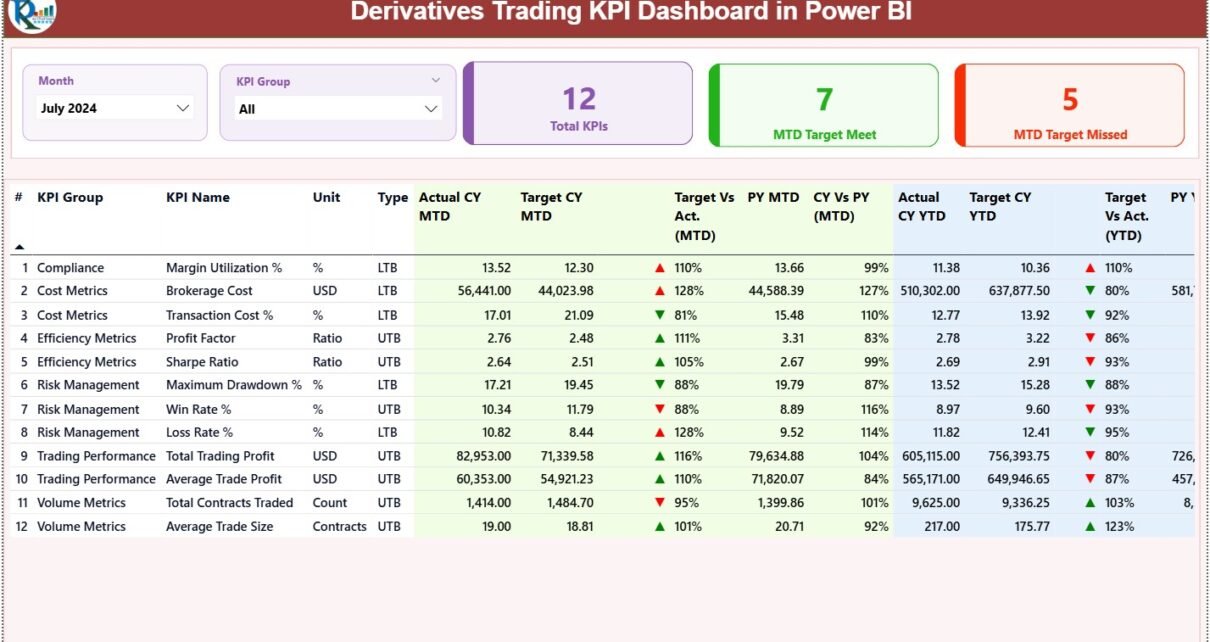
Derivatives Trading KPI Dashboard in Power BI

December 15, 2025December 15, 2025 PKComments Off on Derivatives Trading KPI Dashboard in Power BI
Derivatives trading involves high volumes, rapid market movements, and constant exposure to risk. Therefore, trading teams, risk managers, and leadership always need clear, real-time visibility into performance. However, when data
Read More
Power BI

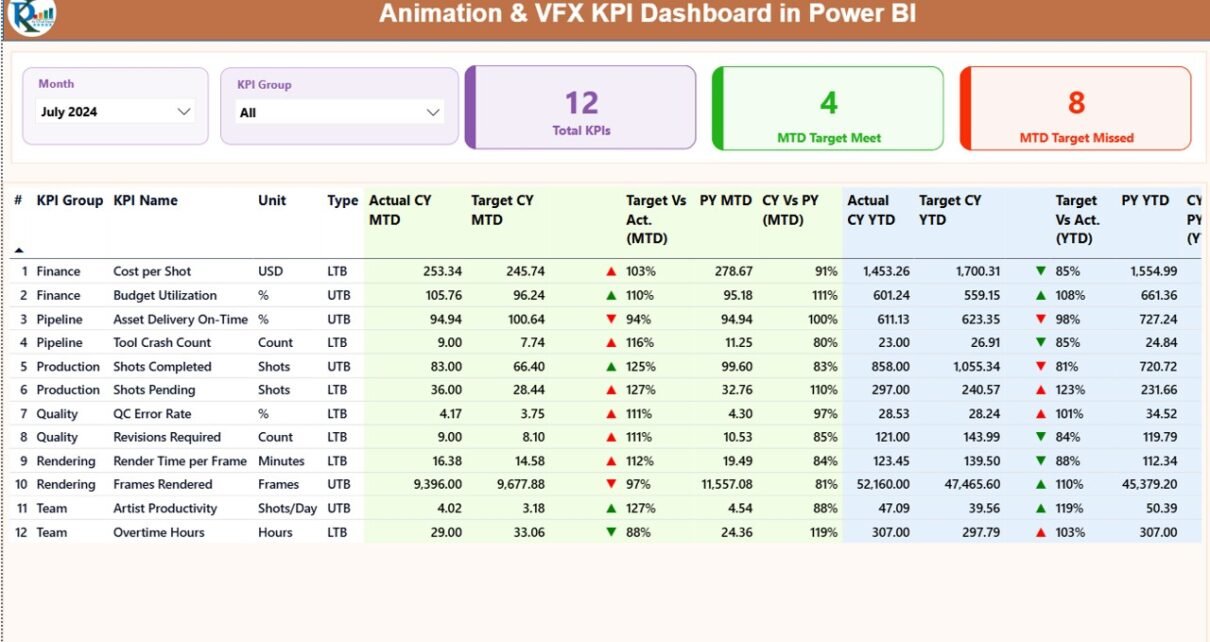
Animation & VFX KPI Dashboard in Power BI

December 13, 2025December 13, 2025 PKComments Off on Animation & VFX KPI Dashboard in Power BI
In today’s fast-moving animation and visual effects industry, studios face constant pressure to deliver high-quality output on time and within budget. At the same time, creative leaders, production managers, and
Read More
Dashboard

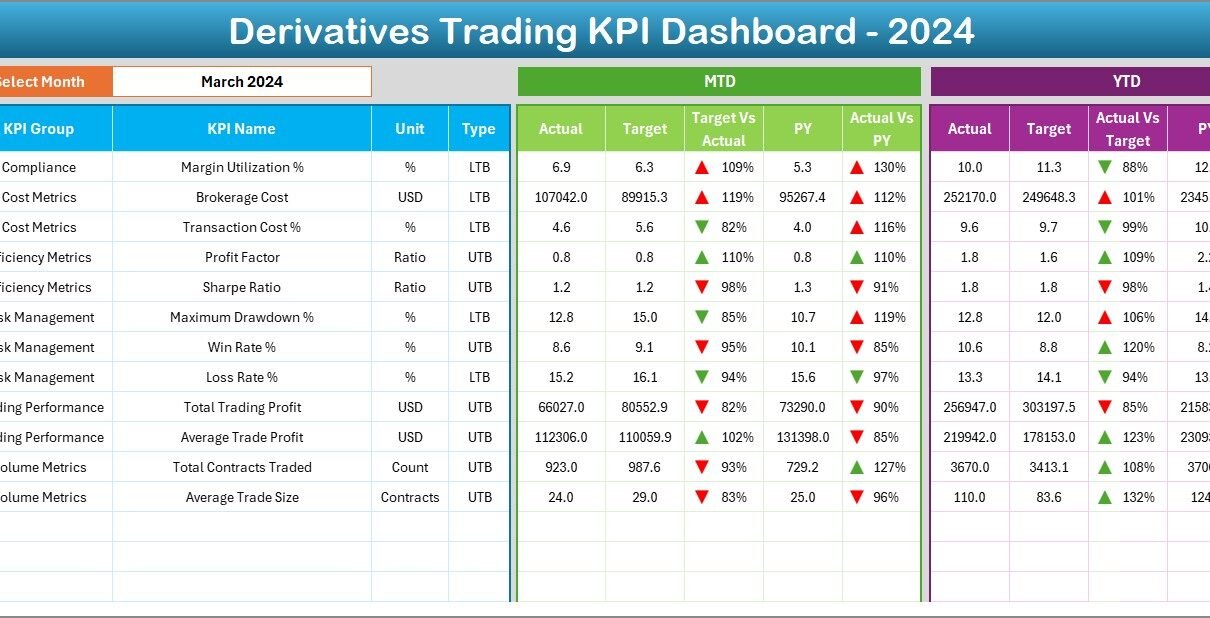
Derivatives Trading KPI Dashboard in Excel

December 9, 2025December 9, 2025 PKComments Off on Derivatives Trading KPI Dashboard in Excel
Derivatives trading involves high risk, fast decisions, and constant performance pressure. Traders, portfolio managers, and risk teams must track results daily, monthly, and yearly to stay profitable and compliant. However,
Read More
Power BI

Stock Exchanges KPI Dashboard in Power BI

December 7, 2025December 7, 2025 PKComments Off on Stock Exchanges KPI Dashboard in Power BI
In today’s fast-moving financial markets, stock exchanges generate massive volumes of data every single day. However, numbers alone do not create clarity. To stay competitive, exchanges, regulators, analysts, and leadership
Read More

Posts pagination

Previous 1 2
  • Learn Excel (Free Course)
    • 1. Shortcut Keys
    • 2. Fill & Flash Fill
    • 3. Find & Replace
    • 4. Sort & Filter
    • 5. Formulas & Functions
    • 6. Data Validation
    • 7. Conditional Formatting
    • 8. Basic Charts
    • 9. Advanced Charts
    • 10. Pivot Tables
    • 11. Excel Dashboards
    • 12. VBA Course
    • 13. Excel Formulas with AI
  • Templates
  • Tutorials
    • Charts and Visualization
    • VBA
    • Excel Tips and Tricks
    • Excel Dashboards
    • Power Pivot & DAX
  • Power BI
  • Template Store
    • Ready to Use Templates
  • Courses
  • Academy
    • Excel + AI Mastery: 100 Formulas
    • Excel Pivot Tables & Dashboards
  • About Us
  • Contact Us
Copyright © 2023 PK-AnExcelExpert.com - Privacy Policy