New: NextGenTemplates Academy - video courses on Excel formulas with AI and Pivot Tables & dashboards. Early-bird: 20% off with code EARLYBIRD20 - first 20 orders only. See the courses →
  • Learn Excel (Free Course)
    • 1. Shortcut Keys
    • 2. Fill & Flash Fill
    • 3. Find & Replace
    • 4. Sort & Filter
    • 5. Formulas & Functions
    • 6. Data Validation
    • 7. Conditional Formatting
    • 8. Basic Charts
    • 9. Advanced Charts
    • 10. Pivot Tables
    • 11. Excel Dashboards
    • 12. VBA Course
    • 13. Excel Formulas with AI
  • Templates
  • Tutorials
    • Charts and Visualization
    • VBA
    • Excel Tips and Tricks
    • Excel Dashboards
    • Power Pivot & DAX
  • Power BI
  • Template Store
    • Ready to Use Templates
  • Courses
  • Academy
    • Excel + AI Mastery: 100 Formulas
    • Excel Pivot Tables & Dashboards
  • About Us
  • Contact Us

PK: An Excel Expert

Transforming Data into Decisions

Tag: Textile KPI Dashboard

Dashboard Power BI

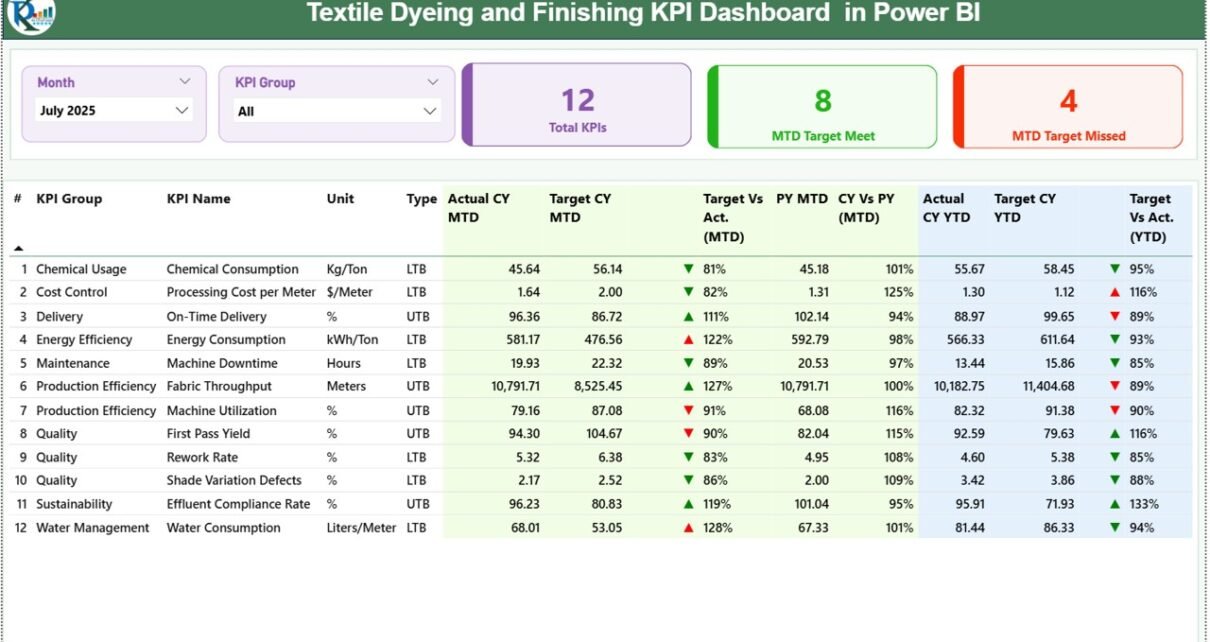
Textile Dyeing and Finishing KPI Dashboard in Power BI

February 24, 2026February 24, 2026 PKComments Off on Textile Dyeing and Finishing KPI Dashboard in Power BI
The textile industry continues to evolve rapidly. Customers demand consistent quality, faster delivery, sustainable processing, and competitive pricing. At the same time, textile dyeing and finishing units handle complex operations
Read More
Dashboard

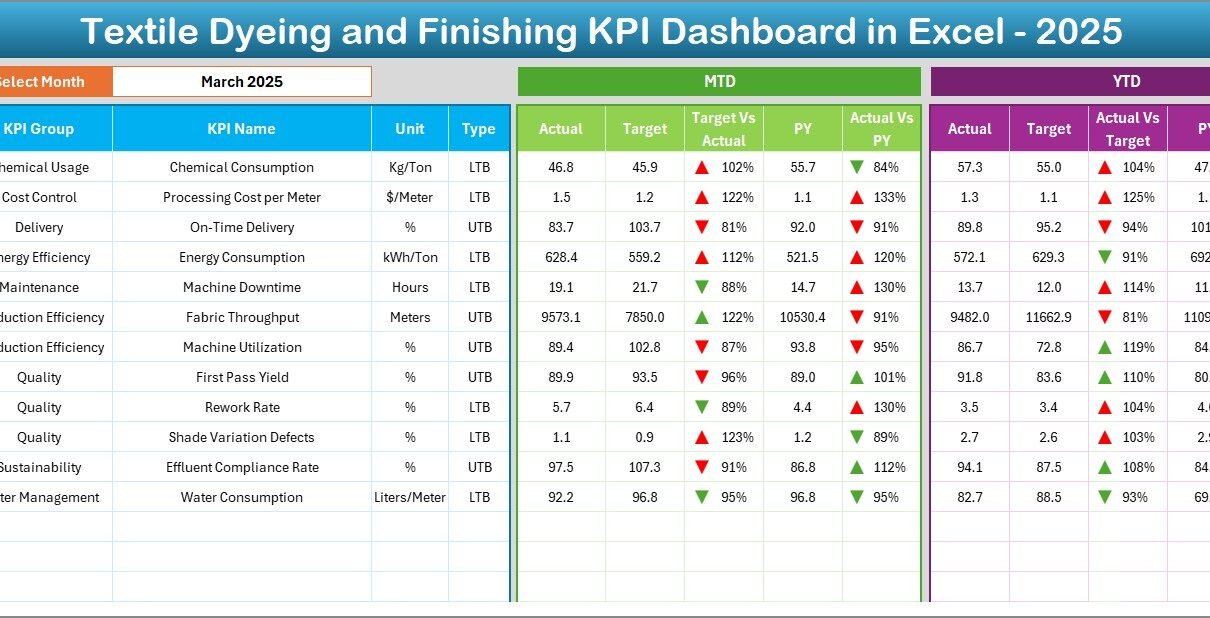
Textile Dyeing and Finishing KPI Dashboard in Excel

February 24, 2026February 24, 2026 PKComments Off on Textile Dyeing and Finishing KPI Dashboard in Excel
The textile industry operates in a highly competitive environment where efficiency, quality, cost control, and delivery timelines determine success. Especially in textile dyeing and finishing operations, even small inefficiencies can
Read More
Power Pivot

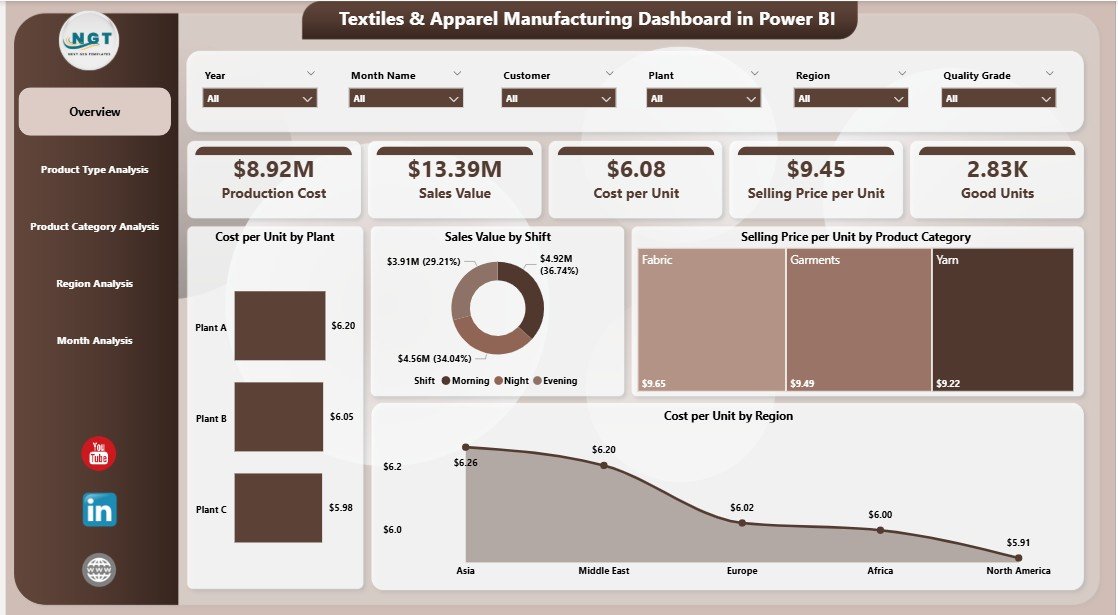
Textiles & Apparel Manufacturing Dashboard in Power BI

January 16, 2026January 16, 2026 PKComments Off on Textiles & Apparel Manufacturing Dashboard in Power BI
The textiles and apparel manufacturing industry operates in a fast-moving, cost-sensitive, and highly competitive environment. Every day, manufacturers track production volumes, unit costs, selling prices, regional demand, and monthly trends.
Read More
Dashboard

Textile Industry KPI Scorecard in Excel

October 13, 2025October 13, 2025 PKComments Off on Textile Industry KPI Scorecard in Excel
The textile industry is one of the most competitive and dynamic sectors worldwide. To maintain profitability and efficiency, businesses need accurate insights into their production, quality, and supply chain performance.
Read More
Dashboard

Textile Industry KPI Dashboard in Excel

November 7, 2024February 25, 2025 PKComments Off on Textile Industry KPI Dashboard in Excel
In the fast-paced and competitive textile industry, monitoring performance is essential for sustaining growth and achieving goals. A well-structured Textile Industry KPI Dashboard in Excel provides a clear view of
Read More
  • Learn Excel (Free Course)
    • 1. Shortcut Keys
    • 2. Fill & Flash Fill
    • 3. Find & Replace
    • 4. Sort & Filter
    • 5. Formulas & Functions
    • 6. Data Validation
    • 7. Conditional Formatting
    • 8. Basic Charts
    • 9. Advanced Charts
    • 10. Pivot Tables
    • 11. Excel Dashboards
    • 12. VBA Course
    • 13. Excel Formulas with AI
  • Templates
  • Tutorials
    • Charts and Visualization
    • VBA
    • Excel Tips and Tricks
    • Excel Dashboards
    • Power Pivot & DAX
  • Power BI
  • Template Store
    • Ready to Use Templates
  • Courses
  • Academy
    • Excel + AI Mastery: 100 Formulas
    • Excel Pivot Tables & Dashboards
  • About Us
  • Contact Us
Copyright © 2023 PK-AnExcelExpert.com - Privacy Policy