New: NextGenTemplates Academy - video courses on Excel formulas with AI and Pivot Tables & dashboards. Early-bird: 20% off with code EARLYBIRD20 - first 20 orders only. See the courses →
  • Learn Excel (Free Course)
    • 1. Shortcut Keys
    • 2. Fill & Flash Fill
    • 3. Find & Replace
    • 4. Sort & Filter
    • 5. Formulas & Functions
    • 6. Data Validation
    • 7. Conditional Formatting
    • 8. Basic Charts
    • 9. Advanced Charts
    • 10. Pivot Tables
    • 11. Excel Dashboards
    • 12. VBA Course
    • 13. Excel Formulas with AI
  • Templates
  • Tutorials
    • Charts and Visualization
    • VBA
    • Excel Tips and Tricks
    • Excel Dashboards
    • Power Pivot & DAX
  • Power BI
  • Template Store
    • Ready to Use Templates
  • Courses
  • Academy
    • Excel + AI Mastery: 100 Formulas
    • Excel Pivot Tables & Dashboards
  • About Us
  • Contact Us

PK: An Excel Expert

Transforming Data into Decisions

Tag: Urban Development Analytics

Dashboard

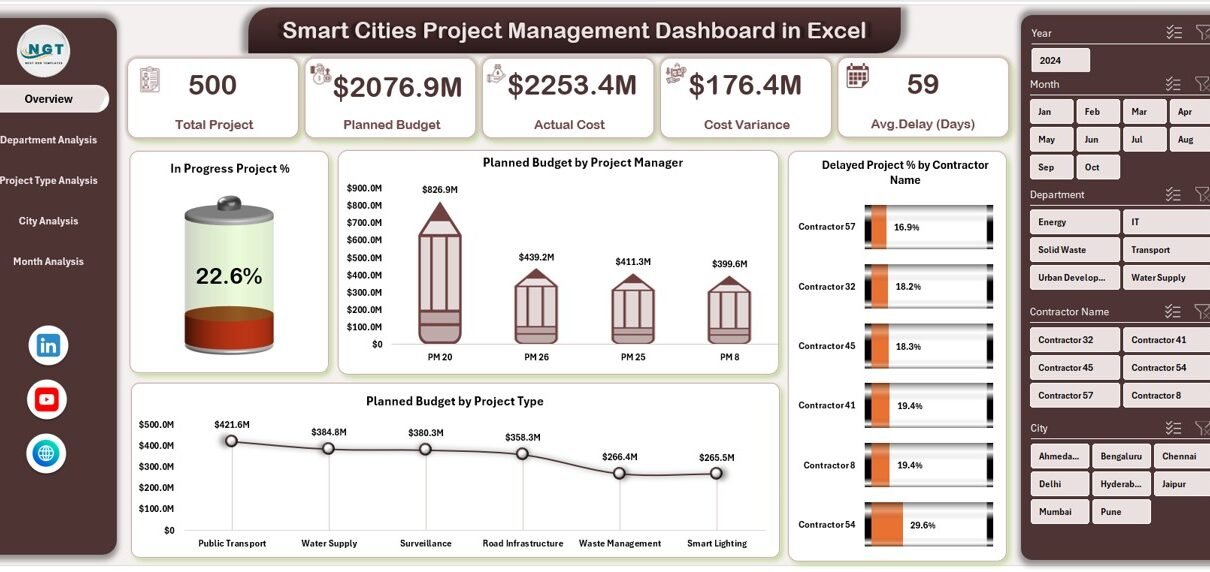
Smart Cities Project Management Dashboard in Excel

December 27, 2025December 27, 2025 PKComments Off on Smart Cities Project Management Dashboard in Excel
Smart cities continue to reshape how governments, municipalities, and urban planners design, execute, and monitor projects. Roads, utilities, public transport, energy systems, water management, and digital infrastructure all operate together
Read More
Dashboard Power BI

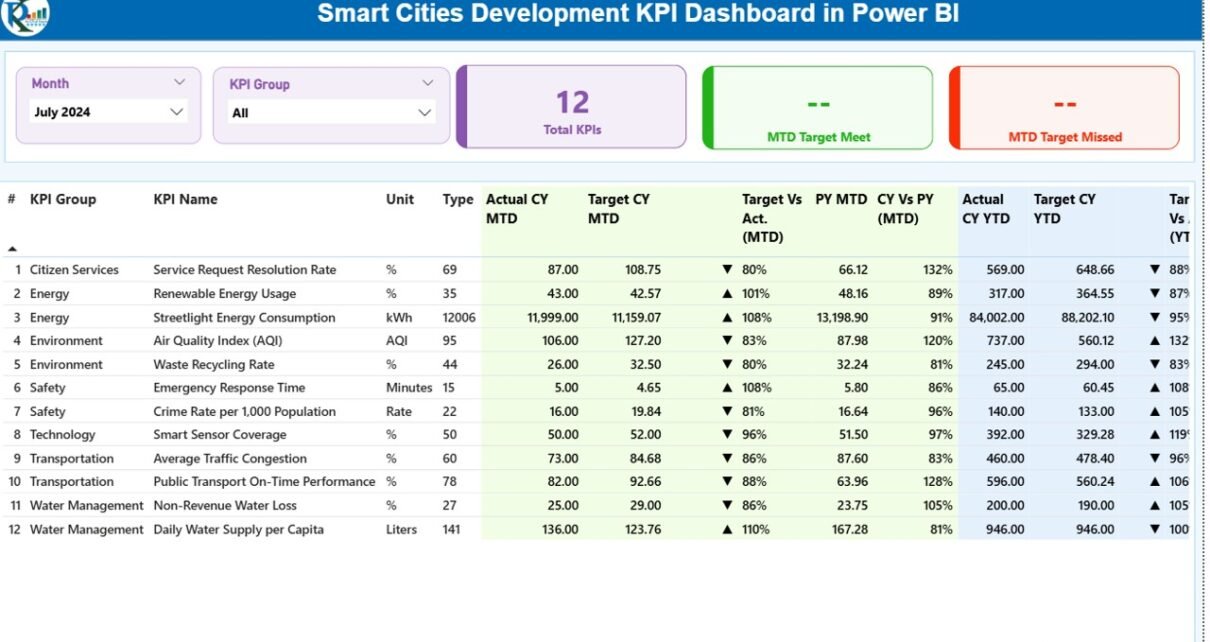
Smart Cities Development KPI Dashboard in Power BI

December 22, 2025December 22, 2025 PKComments Off on Smart Cities Development KPI Dashboard in Power BI
Smart cities continue to reshape how governments plan, build, and manage urban ecosystems. Cities now depend on data to improve infrastructure, enhance citizen services, optimize resources, and ensure sustainable growth.
Read More
Dashboard Power BI

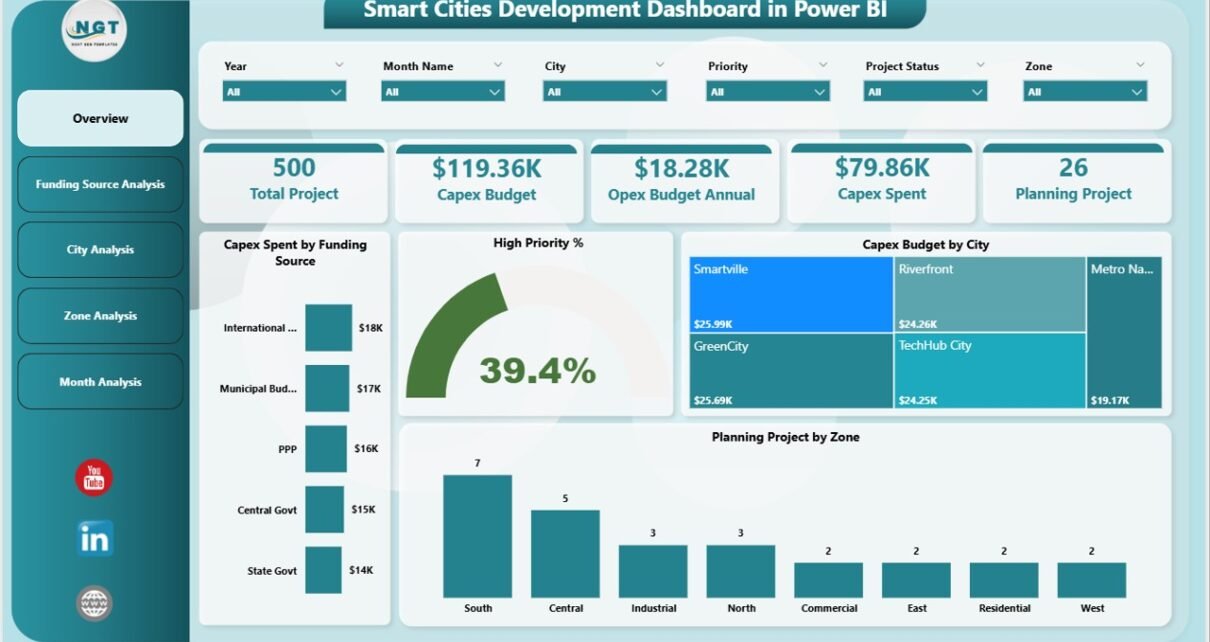
Smart Cities Development Dashboard in Power BI

December 14, 2025December 14, 2025 PKComments Off on Smart Cities Development Dashboard in Power BI
A Smart Cities Development Dashboard in Power BI is a centralized, interactive reporting tool that helps governments, urban planners, and city administrators monitor, analyze, and manage smart city initiatives using
Read More
Dashboard

Smart Cities Development Dashboard in Excel

December 5, 2025December 5, 2025 PKComments Off on Smart Cities Development Dashboard in Excel
Smart cities continue to grow across the world, and every city leader wants better ways to track development activities, measure performance, and improve public services. However, many smart-city teams still
Read More
Templates

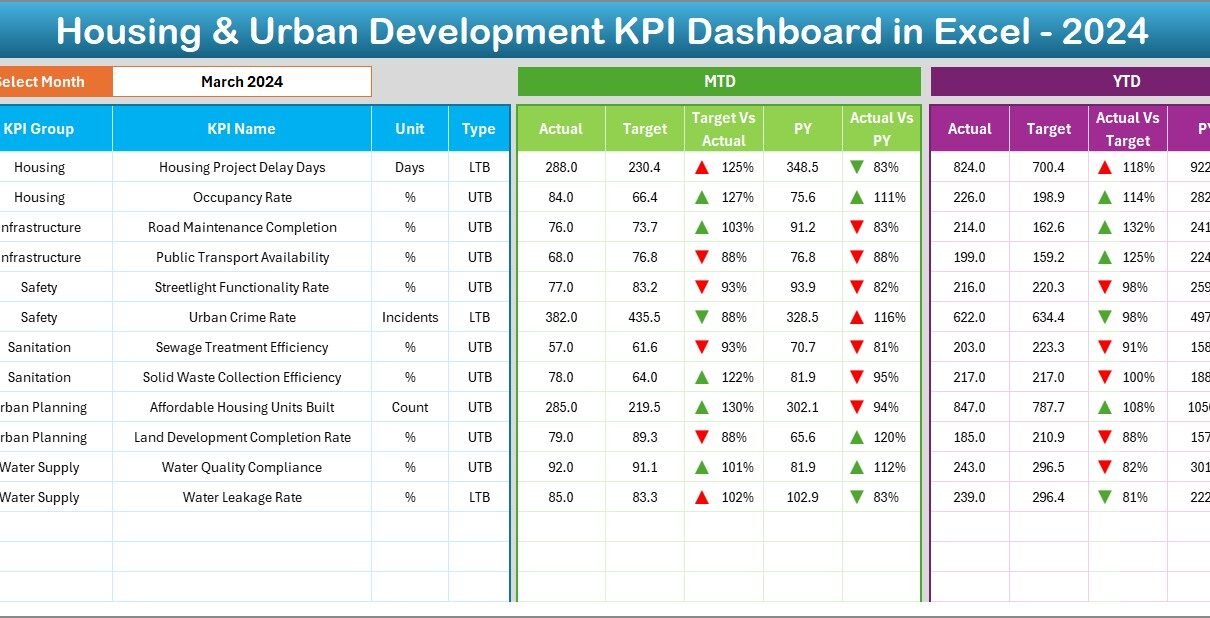
Housing & Urban Development KPI Dashboard in Excel

November 15, 2025November 15, 2025 PKComments Off on Housing & Urban Development KPI Dashboard in Excel
Managing housing and urban development activities takes continuous tracking, smart decision-making, and timely actions. You handle several KPIs such as project completion rates, budget utilization, resident satisfaction, occupancy performance, and
Read More
  • Learn Excel (Free Course)
    • 1. Shortcut Keys
    • 2. Fill & Flash Fill
    • 3. Find & Replace
    • 4. Sort & Filter
    • 5. Formulas & Functions
    • 6. Data Validation
    • 7. Conditional Formatting
    • 8. Basic Charts
    • 9. Advanced Charts
    • 10. Pivot Tables
    • 11. Excel Dashboards
    • 12. VBA Course
    • 13. Excel Formulas with AI
  • Templates
  • Tutorials
    • Charts and Visualization
    • VBA
    • Excel Tips and Tricks
    • Excel Dashboards
    • Power Pivot & DAX
  • Power BI
  • Template Store
    • Ready to Use Templates
  • Courses
  • Academy
    • Excel + AI Mastery: 100 Formulas
    • Excel Pivot Tables & Dashboards
  • About Us
  • Contact Us
Copyright © 2023 PK-AnExcelExpert.com - Privacy Policy