New: NextGenTemplates Academy - video courses on Excel formulas with AI and Pivot Tables & dashboards. Early-bird: 20% off with code EARLYBIRD20 - first 20 orders only. See the courses →
  • Learn Excel (Free Course)
    • 1. Shortcut Keys
    • 2. Fill & Flash Fill
    • 3. Find & Replace
    • 4. Sort & Filter
    • 5. Formulas & Functions
    • 6. Data Validation
    • 7. Conditional Formatting
    • 8. Basic Charts
    • 9. Advanced Charts
    • 10. Pivot Tables
    • 11. Excel Dashboards
    • 12. VBA Course
    • 13. Excel Formulas with AI
  • Templates
  • Tutorials
    • Charts and Visualization
    • VBA
    • Excel Tips and Tricks
    • Excel Dashboards
    • Power Pivot & DAX
  • Power BI
  • Template Store
    • Ready to Use Templates
  • Courses
  • Academy
    • Excel + AI Mastery: 100 Formulas
    • Excel Pivot Tables & Dashboards
  • About Us
  • Contact Us

PK: An Excel Expert

Transforming Data into Decisions

Tag: water management analytics

Dashboard

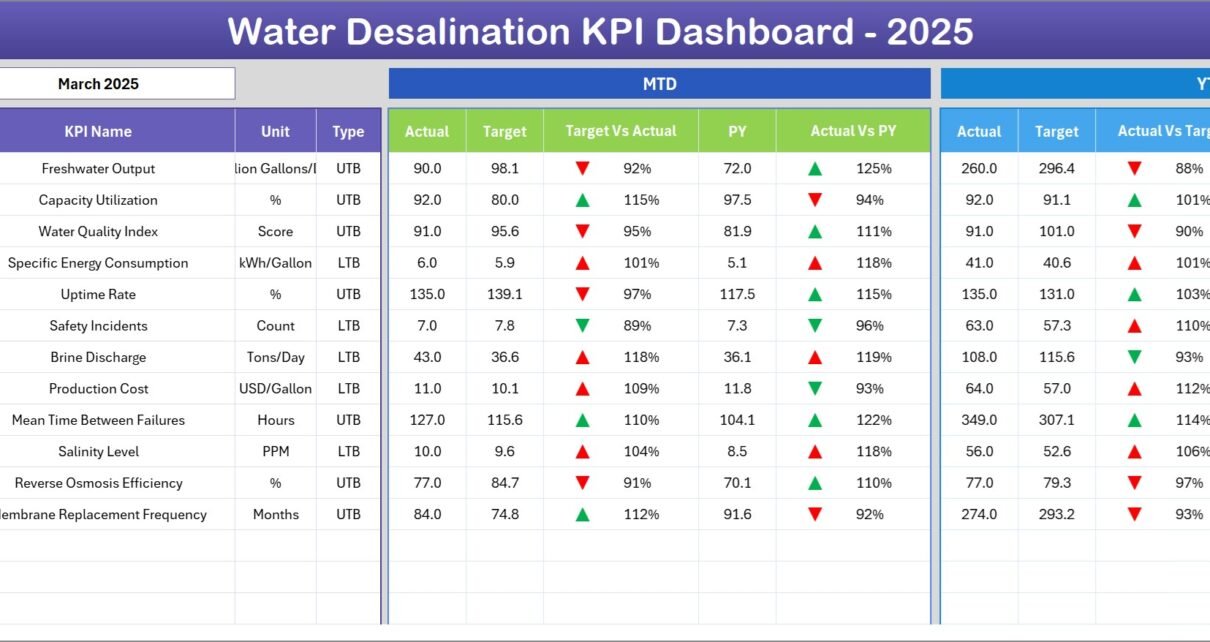
Water Desalination KPI Dashboard in Excel

March 9, 2026March 9, 2026 PKComments Off on Water Desalination KPI Dashboard in Excel
Freshwater scarcity continues to grow worldwide. Many countries now depend on water desalination plants to convert seawater into drinkable water. However, managing a desalination facility involves monitoring multiple operational and
Read More
Dashboard Power BI

Water Harvesting KPI Dashboard in Power BI

January 9, 2026January 9, 2026 PKComments Off on Water Harvesting KPI Dashboard in Power BI
Water scarcity continues to grow as a global challenge. Therefore, organizations, governments, municipalities, and sustainability teams must monitor water harvesting performance more closely than ever. However, when data remains scattered
Read More
Dashboard Power BI

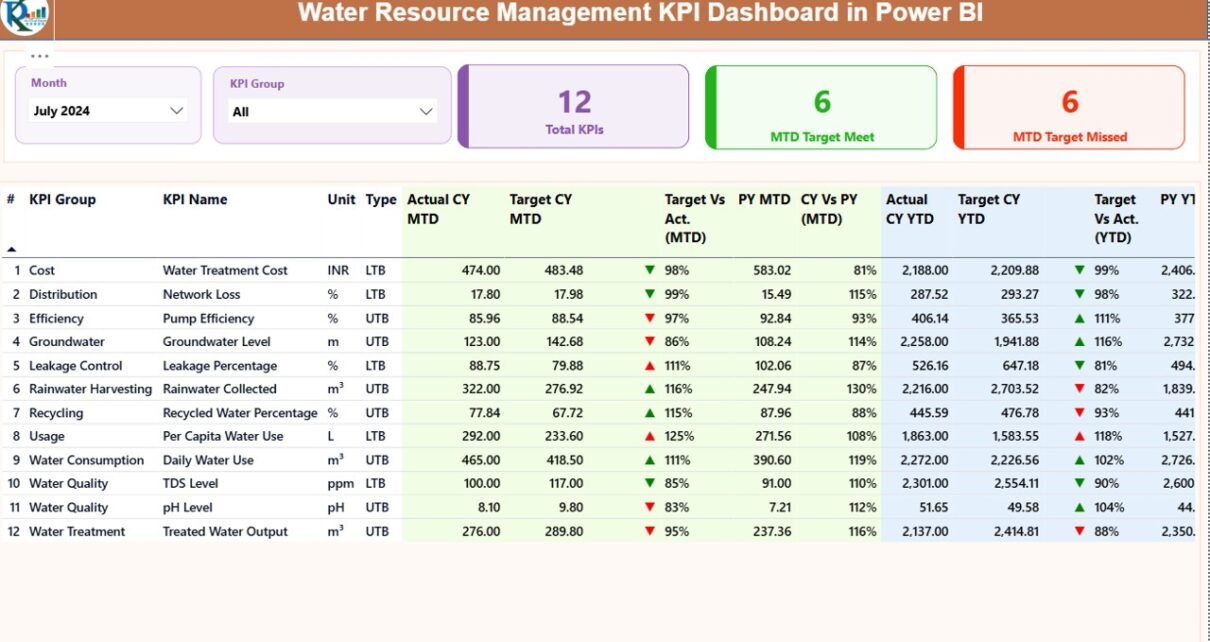
Water Resource Management KPI Dashboard in Power BI

December 16, 2025December 16, 2025 PKComments Off on Water Resource Management KPI Dashboard in Power BI
Water resource management plays a critical role in sustainability, operational efficiency, and regulatory compliance. However, many organizations still track water usage, losses, efficiency, and targets using scattered Excel files or
Read More
Dashboard Power BI

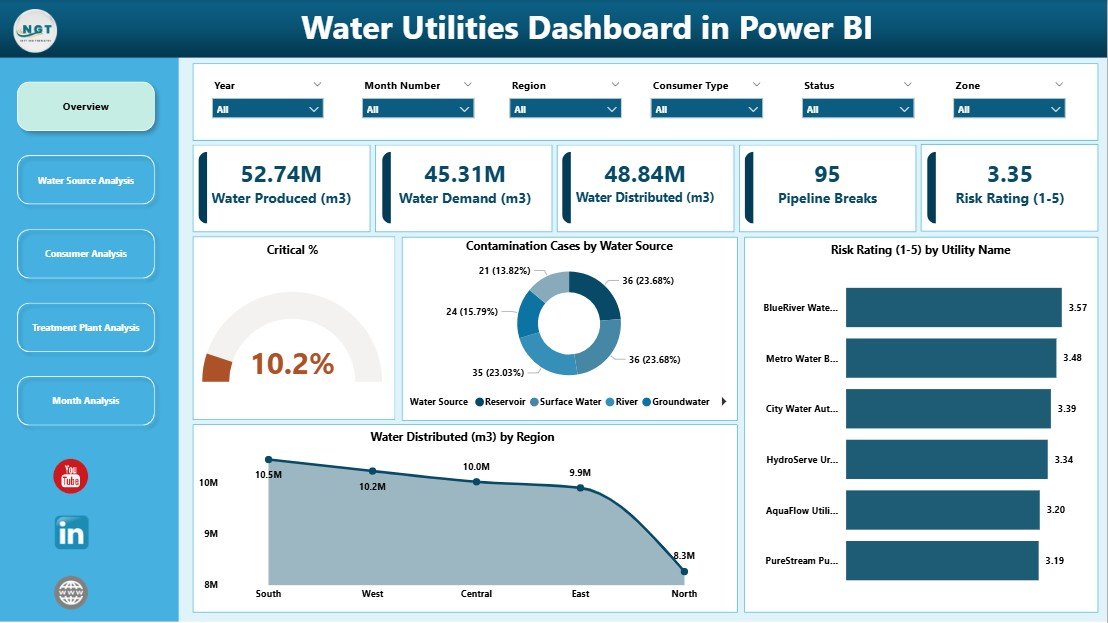
Water Utilities Dashboard in Power BI

December 13, 2025December 13, 2025 PKComments Off on Water Utilities Dashboard in Power BI
In today’s rapidly changing world, water utilities face increasing pressure to manage resources efficiently, ensure water quality, reduce risks, and meet growing consumer demand. However, handling water utility data through
Read More
  • Learn Excel (Free Course)
    • 1. Shortcut Keys
    • 2. Fill & Flash Fill
    • 3. Find & Replace
    • 4. Sort & Filter
    • 5. Formulas & Functions
    • 6. Data Validation
    • 7. Conditional Formatting
    • 8. Basic Charts
    • 9. Advanced Charts
    • 10. Pivot Tables
    • 11. Excel Dashboards
    • 12. VBA Course
    • 13. Excel Formulas with AI
  • Templates
  • Tutorials
    • Charts and Visualization
    • VBA
    • Excel Tips and Tricks
    • Excel Dashboards
    • Power Pivot & DAX
  • Power BI
  • Template Store
    • Ready to Use Templates
  • Courses
  • Academy
    • Excel + AI Mastery: 100 Formulas
    • Excel Pivot Tables & Dashboards
  • About Us
  • Contact Us
Copyright © 2023 PK-AnExcelExpert.com - Privacy Policy