Managing refinery projects requires precision, speed, and clear visibility. Refinery projects often involve high capital investment, safety risks, multiple departments, and strict timelines. Therefore, project managers must track performance accurately and make fast decisions based on real data.
That is exactly where the Refinery Project Management Dashboard in Excel becomes an essential tool.
In this detailed guide, you will learn everything about the Refinery Project Management Dashboard in Excel, including its features, structure, benefits, best practices, and real-world usage. Moreover, this article explains each dashboard section in a simple and practical way so you can easily understand and implement it in your organization.
Click to Purchases Refinery Project Management Dashboard in Excel
What Is a Refinery Project Management Dashboard in Excel?
A Refinery Project Management Dashboard in Excel is a centralized analytical tool that helps refinery teams monitor, track, and evaluate project performance using visual KPIs and charts.
Instead of managing multiple spreadsheets and reports, this dashboard brings all project-related data into one structured Excel file. As a result, decision-makers can easily track project progress, cost performance, safety impact, and departmental efficiency.
Moreover, since the dashboard runs in Excel, teams can use it without learning complex software or investing in expensive BI tools.
Why Do Refinery Projects Need a Dashboard?
Refinery projects involve high risk, high cost, and strict compliance standards. Therefore, manual tracking often leads to errors, delays, and poor visibility.
A Refinery Project Management Dashboard helps because:
-
It centralizes all project data
-
It improves decision-making speed
-
It highlights cost overruns instantly
-
It tracks safety-critical projects
-
It increases accountability across teams
As a result, refinery managers gain complete control over project performance.
Overview of the Refinery Project Management Dashboard
This Excel-based dashboard is a ready-to-use project monitoring solution designed specifically for refinery operations.
The dashboard includes:
-
A Page Navigator for easy movement
-
Five interactive analytical pages
-
Visual KPIs and charts
-
Department-level and project-level insights
-
Monthly performance analysis
-
Budget and cost tracking
Let us now explore each section in detail.
Page Navigator – Easy and Quick Navigation
The Page Navigator appears on the left side of the dashboard.
This feature allows users to:
-
Switch between dashboard pages easily
-
Save time while analyzing data
-
Improve user experience
-
Avoid confusion between multiple sheets
Because of this navigation panel, even non-technical users can operate the dashboard smoothly.
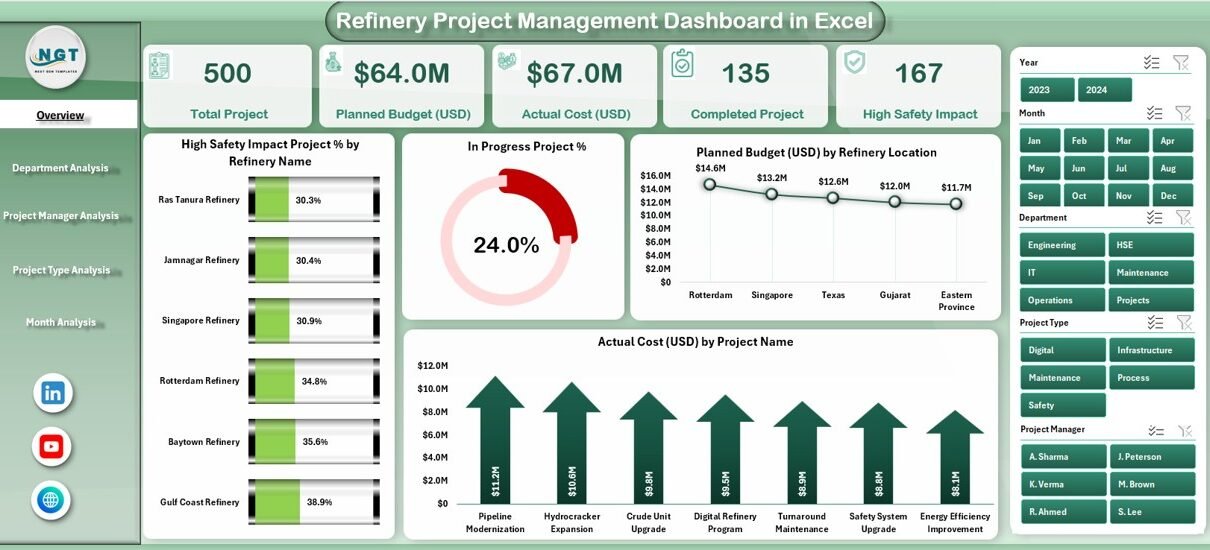
1. Overview Page – Complete Project Summary at a Glance
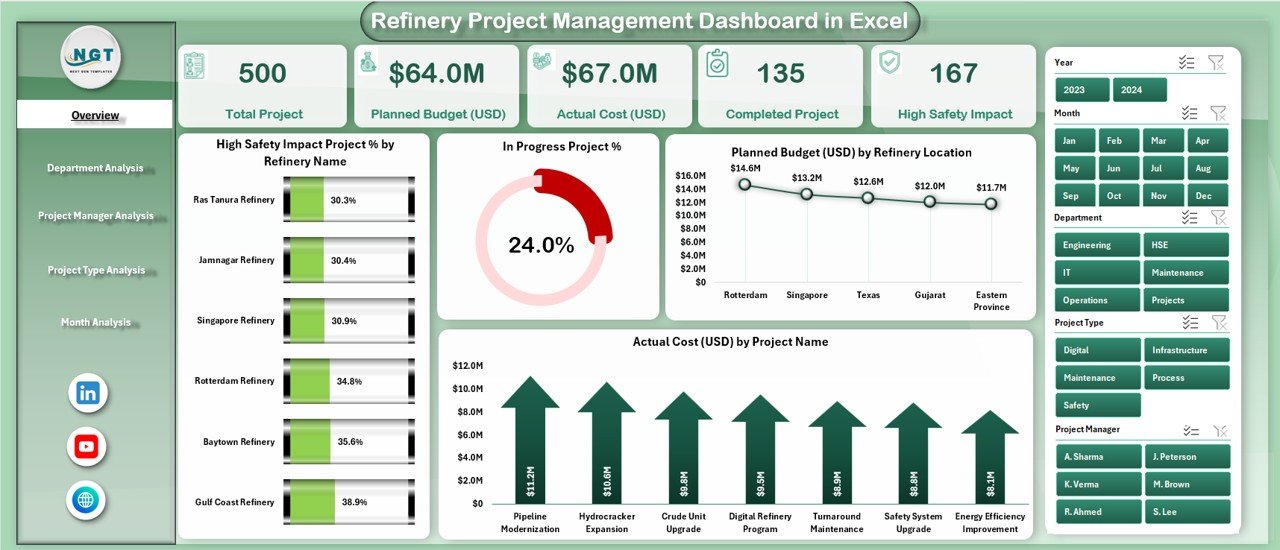
The Overview Page serves as the main dashboard screen. It provides a high-level summary of all refinery projects.
Key Features of the Overview Page
This page includes:
✅ KPI Cards
The dashboard displays four important KPI cards, which show:
Click to Purchases Refinery Project Management Dashboard in Excel
-
Overall project performance
-
Safety impact level
-
Budget utilization
-
Cost performance
These cards give instant visibility into the project health.
📊 Charts on Overview Page
The overview page includes four powerful charts:
1️⃣ High Safety Impact Project % by Refinery Name
This chart shows:
-
Percentage of high-risk projects
-
Safety exposure across refinery units
-
Areas that need immediate attention
2️⃣ In-Progress Project % by Refinery
This chart helps:
-
Track active projects
-
Identify workload distribution
-
Monitor project backlog
3️⃣ Planned Budget (USD) by Refinery Location
This chart:
-
Displays budget allocation
-
Helps compare budget across refineries
-
Supports financial planning
4️⃣ Actual Cost by Project Name
This chart:
-
Shows actual spending
-
Highlights cost overruns
-
Supports cost control decisions
As a result, managers get a clear financial and operational overview.
2. Department Analysis – Performance by Department
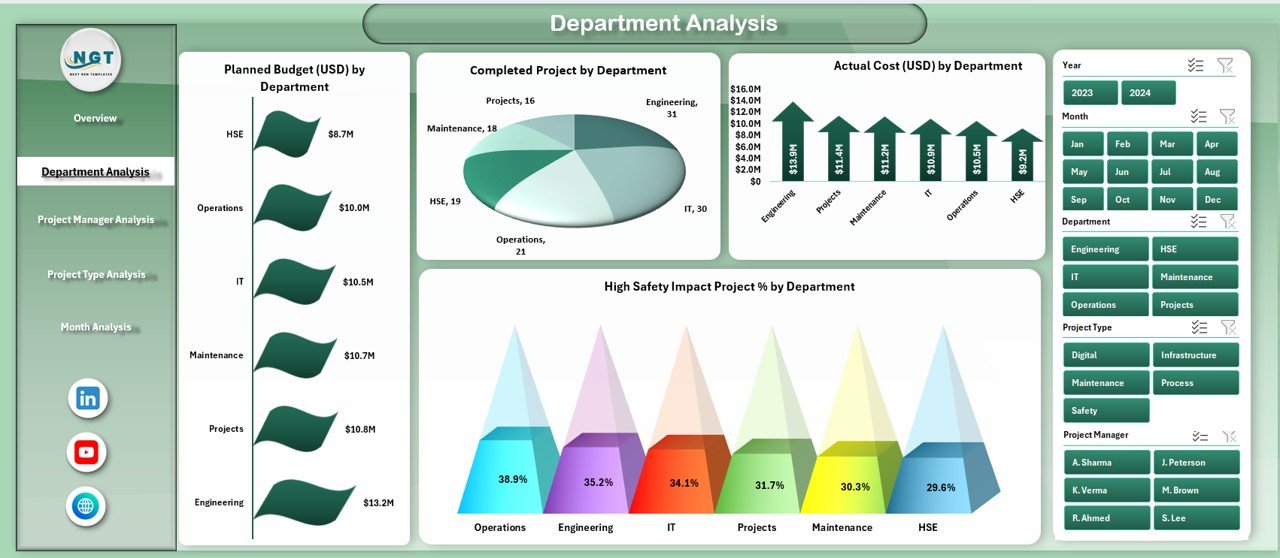
The Department Analysis page focuses on evaluating project performance department-wise.
This page helps refinery leadership understand which departments perform well and which require improvement.
📊 Charts in Department Analysis
1️⃣ Planned Budget by Department
This chart shows:
-
Budget allocation by department
-
Department-level planning accuracy
-
Investment distribution
2️⃣ Completed Projects by Department
This chart helps:
-
Measure productivity
-
Track delivery performance
-
Compare departments
3️⃣ Actual Cost by Department
This chart:
-
Shows cost consumption
-
Highlights overspending
-
Supports cost optimization
4️⃣ High Safety Impact Project % by Department
This chart:
-
Identifies safety-critical departments
-
Supports safety planning
-
Helps reduce operational risk
As a result, management can take corrective action quickly.
3. Project Manager Analysis – Performance Evaluation
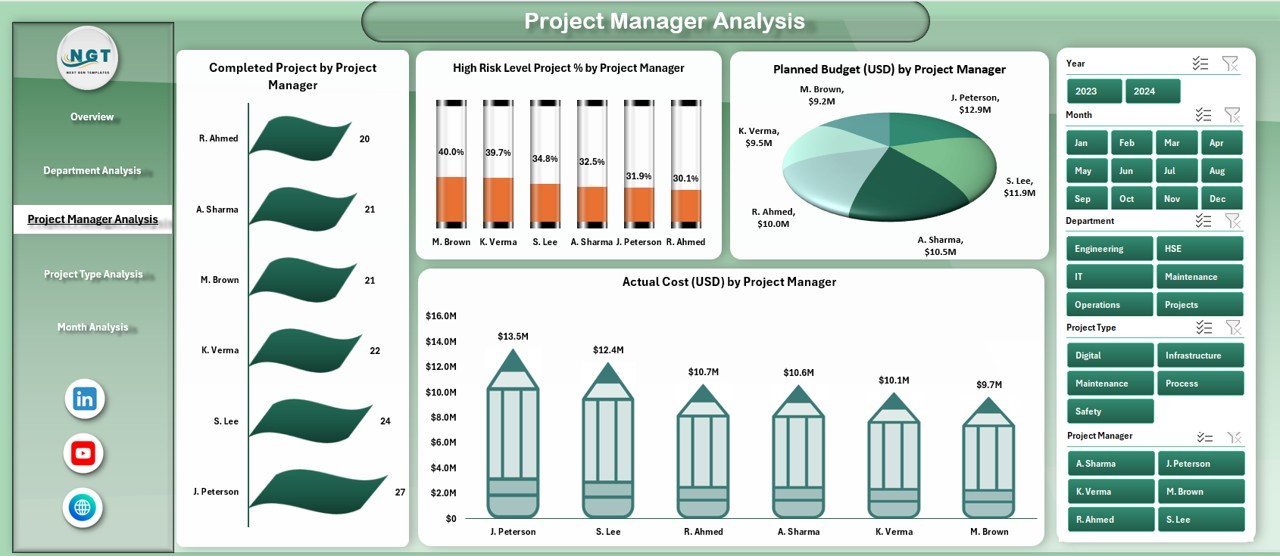
The Project Manager Analysis page evaluates individual project manager performance.
This section helps organizations ensure accountability and performance transparency.
📊 Charts in Project Manager Analysis
1️⃣ Completed Projects by Project Manager
This chart shows:
-
Project delivery efficiency
-
Individual performance comparison
-
Workload distribution
2️⃣ High Risk Level Project % by Project Manager
Click to Purchases Refinery Project Management Dashboard in Excel
This chart helps:
-
Identify risk-heavy projects
-
Evaluate risk-handling ability
-
Improve safety planning
3️⃣ Planned Budget by Project Manager
This chart:
-
Displays budget responsibility
-
Tracks project scale
-
Supports budget planning
4️⃣ Actual Cost by Project Manager
This chart:
-
Tracks cost management skills
-
Highlights overruns
-
Improves financial discipline
Therefore, leadership can reward high performers and support underperforming teams.
4. Project Type Analysis – Performance by Project Category
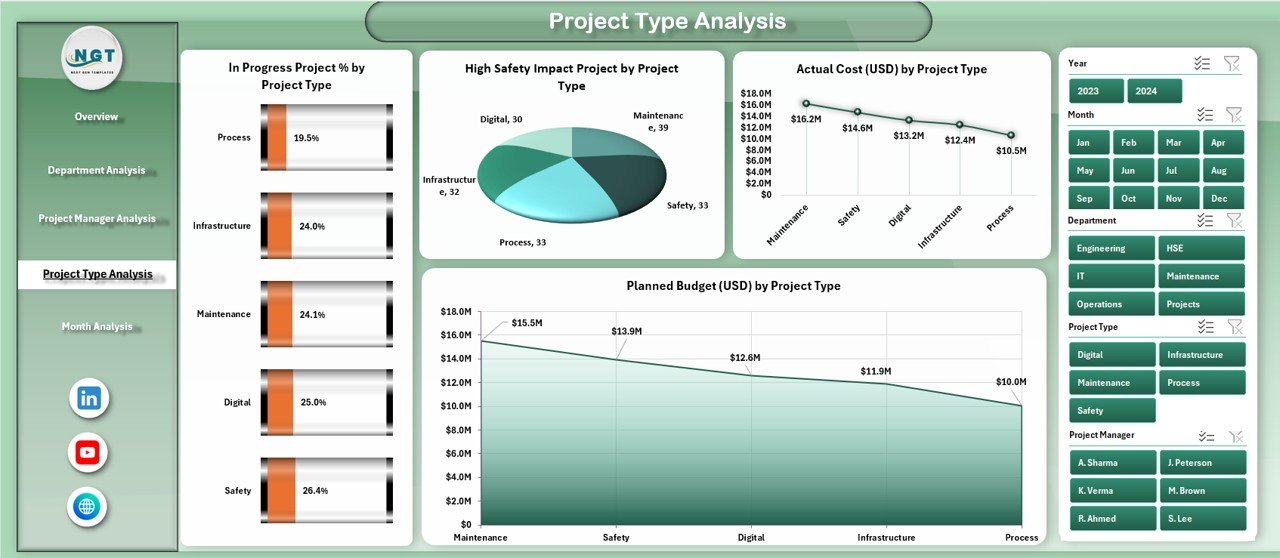
The Project Type Analysis page helps analyze different types of refinery projects.
This section supports better project classification and investment planning.
📊 Charts in Project Type Analysis
1️⃣ In-Progress Project % by Project Type
This chart:
-
Shows workload by project type
-
Highlights delayed project categories
2️⃣ High Safety Impact Projects by Project Type
This chart:
-
Identifies high-risk project categories
-
Supports safety planning
-
Improves compliance management
3️⃣ Actual Cost by Project Type
This chart:
-
Tracks spending trends
-
Helps identify cost-heavy project types
4️⃣ Planned Budget by Project Type
This chart:
-
Shows budget allocation
-
Supports future budgeting
-
Helps in cost forecasting
As a result, management can allocate resources more efficiently.
Click to Purchases Refinery Project Management Dashboard in Excel
5. Month Analysis – Monthly Project Performance
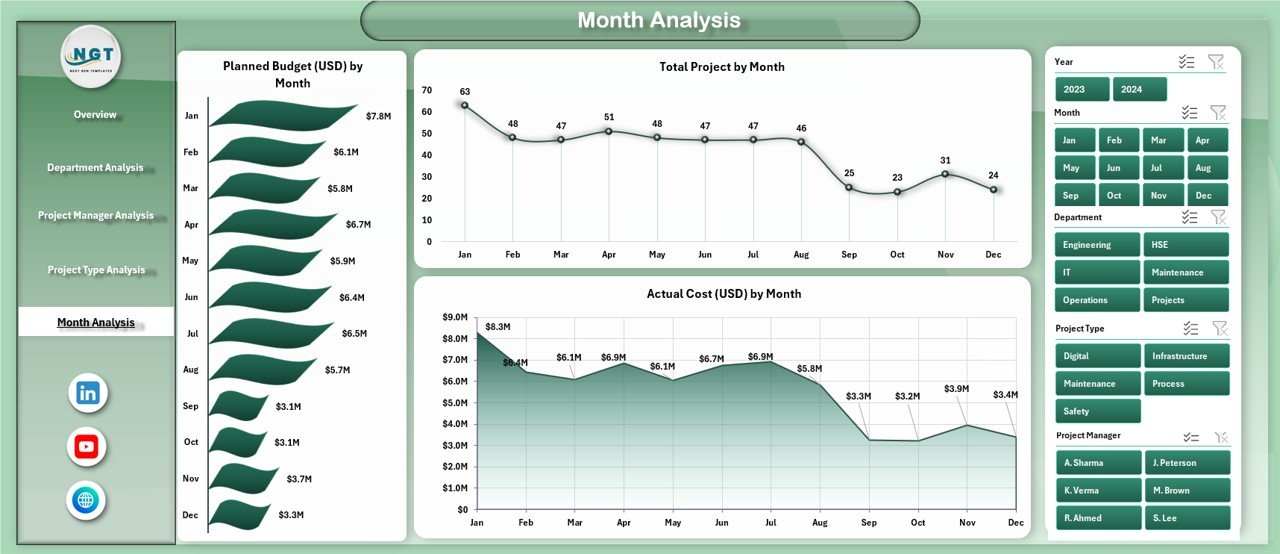
The Month Analysis page provides time-based insights.
This page helps track trends, seasonality, and monthly performance changes.
📊 Charts in Month Analysis
1️⃣ Planned Budget by Month
This chart:
-
Shows monthly budget allocation
-
Supports financial planning
2️⃣ Total Projects by Month
This chart:
-
Tracks workload trends
-
Helps resource planning
3️⃣ Actual Cost by Month
This chart:
-
Shows monthly expenses
-
Identifies overspending months
-
Supports cost control
As a result, managers can predict future costs and plan better.
Support Sheet and Data Sheet
📁 Data Sheet
The Data Sheet acts as the backend of the dashboard.
It contains:
-
Project details
-
Department information
-
Budget values
-
Cost figures
-
Safety indicators
-
Time-based data
All dashboard visuals automatically update based on this data.
🛠 Support Sheet
The Support Sheet:
-
Stores helper tables
-
Maintains dropdown lists
-
Supports chart calculations
-
Improves dashboard performance
This structure ensures accuracy and flexibility.
Advantages of Refinery Project Management Dashboard in Excel
✅ Centralized Project Tracking
You can track all refinery projects from one dashboard.
✅ Better Decision Making
Clear visuals help managers take quick and informed actions.
✅ Improved Cost Control
Budget vs actual analysis helps reduce overspending.
✅ Enhanced Safety Monitoring
Safety-related KPIs highlight risk areas early.
✅ Increased Transparency
All stakeholders see the same data.
✅ Easy Customization
You can modify the dashboard based on your needs.
✅ No Extra Software Required
Excel works without BI tools or licenses.
Best Practices for Using Refinery Project Management Dashboard
✔ Keep Data Updated Regularly
Always update project data to maintain accuracy.
✔ Standardize Data Entry
Use consistent formats for better analysis.
✔ Review KPIs Weekly
Weekly reviews help prevent delays.
✔ Use Filters Wisely
Apply filters to analyze specific departments or periods.
✔ Train Team Members
Ensure all users understand the dashboard.
✔ Monitor Safety Metrics Closely
Never ignore high-risk indicators.
✔ Compare Planned vs Actual Regularly
This improves budgeting and forecasting.
Who Can Use This Dashboard?
This dashboard is ideal for:
-
Refinery Project Managers
-
Operations Managers
-
Planning Engineers
-
Safety Officers
-
Finance Teams
-
Senior Management
-
Project Control Analysts
Why Excel Is the Best Choice for This Dashboard
Excel remains one of the most powerful tools because:
-
It is widely available
-
It supports advanced charts
-
It allows customization
-
It works offline
-
It requires no coding
-
It integrates easily with other systems
Therefore, Excel remains a preferred choice for refinery project management.
Click to Purchases Refinery Project Management Dashboard in Excel
Conclusion
The Refinery Project Management Dashboard in Excel provides a complete solution for tracking project performance, managing costs, improving safety, and increasing operational efficiency.
With structured pages, interactive charts, and detailed analysis, this dashboard helps refinery teams make smarter decisions and reduce project risks. Moreover, its Excel-based design ensures ease of use and flexibility.
If you want better control over refinery projects, improved visibility, and data-driven decisions, this dashboard serves as the perfect solution.
Frequently Asked Questions (FAQs)
❓ What is a Refinery Project Management Dashboard in Excel?
It is an Excel-based tool that tracks refinery project performance, costs, safety, and progress using visual KPIs.
❓ Who should use this dashboard?
Project managers, refinery engineers, planners, safety teams, and senior management can use it.
❓ Can I customize the dashboard?
Yes. You can modify KPIs, charts, and layouts based on your project needs.
❓ Does this dashboard require advanced Excel skills?
No. Basic Excel knowledge is enough to use and update it.
❓ Can I track multiple refinery locations?
Yes. The dashboard supports location-wise and department-wise analysis.
❓ Is this dashboard suitable for large projects?
Yes. It works well for both small and large refinery projects.
❓ Can I use it for reporting?
Absolutely. You can use it for monthly reviews, management reports, and audits.
Visit our YouTube channel to learn step-by-step video tutorials