Managing outsourced accounting services requires accurate performance tracking, transparency, and data-driven decision making. However, many organizations still rely on scattered spreadsheets and manual reporting. As a result, managers struggle to measure performance, identify issues, and improve productivity.
Therefore, businesses increasingly use Power BI dashboards to track accounting performance efficiently. One powerful solution is the Outsourced Accounting KPI Dashboard in Power BI.
This dashboard transforms complex accounting data into clear, interactive, and actionable insights. Moreover, it allows companies to monitor key metrics such as productivity, service quality, deadlines, and financial performance.
In this detailed guide, you will learn everything about the Outsourced Accounting KPI Dashboard in Power BI, including its features, benefits, best practices, and frequently asked questions.
Click to Purchases Outsourced Accounting KPI Dashboard in Power BI
What is an Outsourced Accounting KPI Dashboard in Power BI?
An Outsourced Accounting KPI Dashboard in Power BI is an interactive analytics tool that helps organizations monitor the performance of outsourced accounting teams.
Many companies outsource accounting functions such as:
-
Accounts payable processing
-
Accounts receivable management
-
Payroll processing
-
Financial reporting
-
Bookkeeping services
-
Tax preparation
-
Compliance monitoring
However, without structured performance monitoring, companies cannot evaluate service quality effectively.
Therefore, the Power BI KPI dashboard centralizes all accounting metrics into one visual platform. Managers can easily track targets, compare performance with previous periods, and identify improvement opportunities.
Moreover, Power BI provides interactive charts, slicers, and drill-through functionality, which makes performance analysis easier and faster.
Why Do Businesses Need an Outsourced Accounting KPI Dashboard?
Organizations outsource accounting services to improve efficiency and reduce operational costs. However, outsourcing also requires strong performance monitoring.
Therefore, businesses use KPI dashboards for several important reasons.
1. Monitor Team Performance
Managers can track whether outsourced accounting teams meet performance targets.
2. Improve Accountability
The dashboard highlights missed targets and underperforming KPIs. Consequently, managers can take corrective actions quickly.
3. Make Data-Driven Decisions
Instead of relying on manual reports, leaders can analyze real-time performance insights.
4. Improve Service Quality
The dashboard reveals performance gaps. As a result, organizations can improve processes and maintain service standards.
Key Features of the Outsourced Accounting KPI Dashboard in Power BI
The Outsourced Accounting KPI Dashboard in Power BI includes three powerful analytical pages. Each page focuses on a different aspect of KPI monitoring.
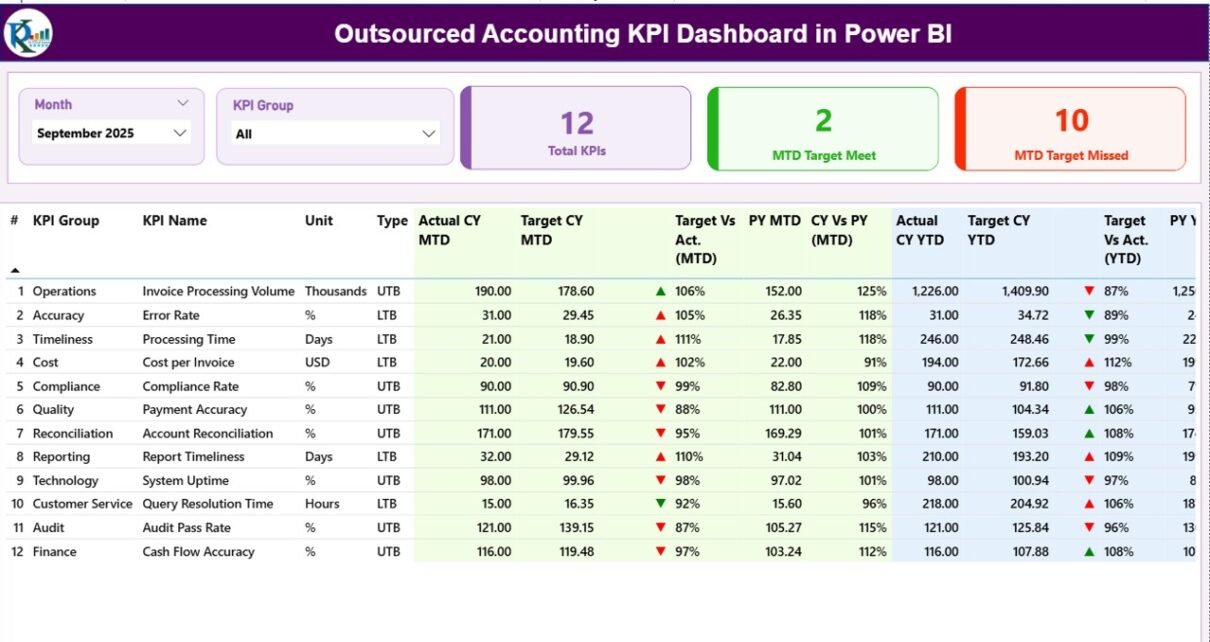
1. Summary Page – The Main Performance Overview

The Summary Page acts as the main dashboard where users can view overall accounting performance.
At the top of the dashboard, users can find interactive slicers that allow them to filter data.
Click to Purchases Outsourced Accounting KPI Dashboard in Power BI
Available Slicers
-
Month
-
KPI Group
These slicers allow managers to analyze KPI performance for specific months or categories.
KPI Performance Cards
The dashboard displays three key KPI cards that provide instant insights.
-
Total KPIs Count – Shows the total number of KPIs tracked in the dashboard.
-
MTD Target Meet Count – Shows the number of KPIs that achieved their monthly targets.
-
MTD Target Missed Count – Shows the number of KPIs that failed to meet their monthly targets.
These cards help managers quickly evaluate overall performance.
Detailed KPI Table
Below the KPI cards, the dashboard displays a detailed KPI performance table.
This table includes several important columns.
KPI Number
This column shows the sequence number of each KPI.
KPI Group
This column identifies the category or group of the KPI, such as productivity, quality, compliance, or financial performance.
KPI Name
This column shows the name of the KPI being measured.
Unit
This column defines the measurement unit of the KPI, such as percentage, hours, or number of transactions.
Type
This column defines the KPI type.
-
LTB (Lower the Better) – Lower values represent better performance.
-
UTB (Upper the Better) – Higher values represent better performance.
MTD Performance Metrics
The dashboard includes several Month-To-Date (MTD) performance metrics.
Actual CY MTD
This column shows the actual performance value for the current year MTD.
Target CY MTD
This column displays the target performance value for the current year MTD.
MTD Icon
The dashboard displays performance icons:
-
▲ Green icon → Target achieved
-
▼ Red icon → Target missed
These icons allow users to identify performance status quickly.
Target vs Actual (MTD)
This column shows the percentage comparison between target and actual MTD values.
Formula used:
Actual MTD ÷ Target MTD
PY MTD
This column shows MTD performance for the same period in the previous year.
CY vs PY (MTD)
This column compares current year MTD performance with previous year MTD performance.
Formula used:
Current Year MTD ÷ Previous Year MTD
Click to Purchases Outsourced Accounting KPI Dashboard in Power BI
YTD Performance Metrics
The dashboard also tracks Year-To-Date (YTD) performance metrics.
Actual CY YTD
This column shows the actual KPI performance for the current year YTD.
Target CY YTD
This column displays the target KPI value for the current year YTD.
YTD Icon
Similar to the MTD icon, the dashboard uses visual indicators.
-
▲ Green icon → Target achieved
-
▼ Red icon → Target missed
Target vs Actual (YTD)
This column compares actual YTD values with target YTD values.
Formula used:
Actual YTD ÷ Target YTD
PY YTD
This column displays YTD values for the same period in the previous year.
CY vs PY (YTD)
This column compares current year YTD performance with previous year YTD performance.
Formula used:
Current Year YTD ÷ Previous Year YTD
2. KPI Trend Page – Performance Analysis Over Time
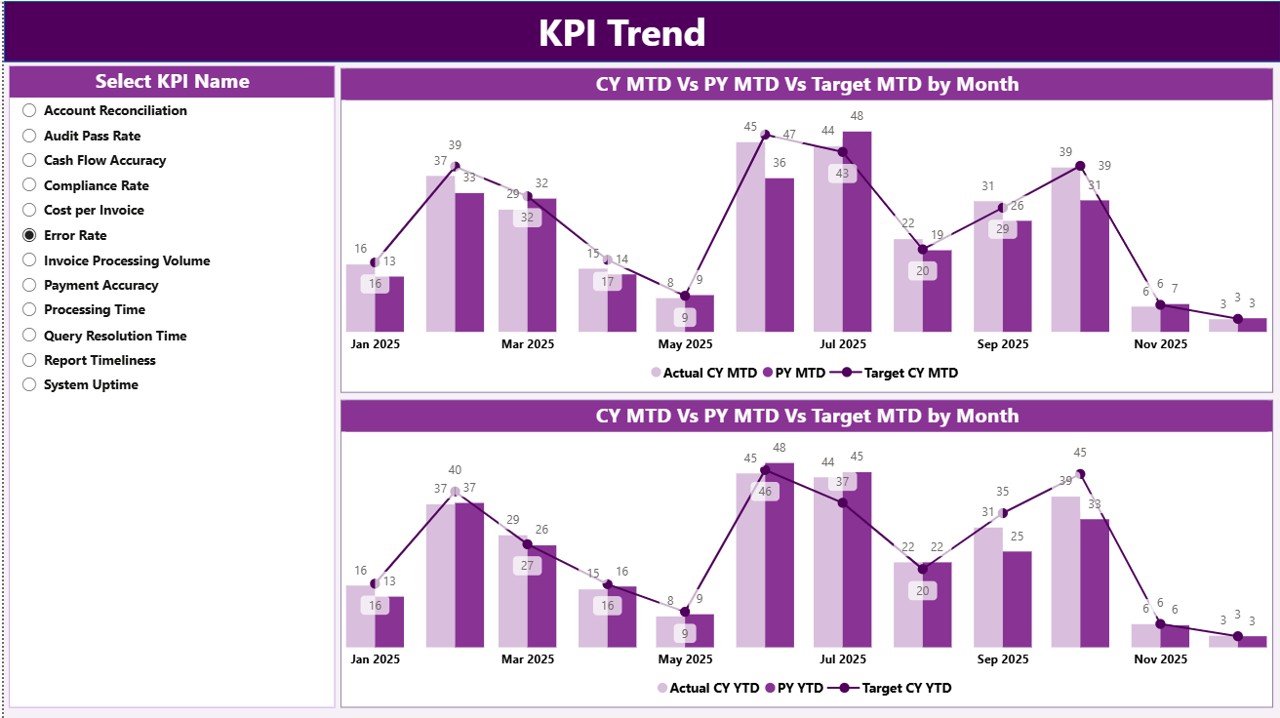
The KPI Trend Page helps users analyze KPI performance trends over time.
Instead of reviewing static numbers, managers can visualize performance changes.
Key Features of the KPI Trend Page
This page contains two combo charts.
These charts display:
-
Current Year Actual Values
-
Previous Year Actual Values
-
Target Values
MTD Trend Chart
This chart shows Month-To-Date KPI performance trends.
Managers can easily identify performance improvements or declines.
YTD Trend Chart
This chart shows Year-To-Date performance trends.
Therefore, organizations can track long-term performance progress.
KPI Name Slicer
On the left side of the page, users can select a specific KPI name using a slicer.
As a result, the dashboard instantly updates charts to show trends for the selected KPI.
3. KPI Definition Page – Detailed KPI Explanation
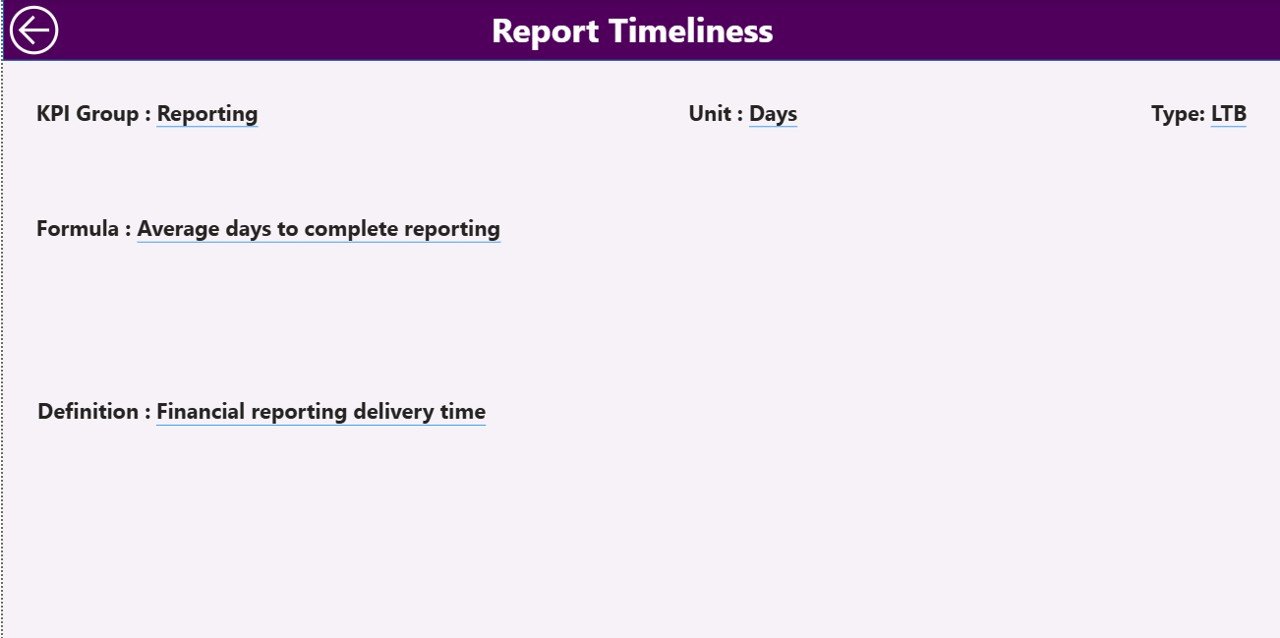
The KPI Definition Page provides detailed explanations for each KPI.
This page acts as a drill-through page.
Users can navigate from the Summary Page to this page to view detailed KPI information.
Information Available on the KPI Definition Page
This page includes:
-
KPI Number
-
KPI Group
-
KPI Name
-
KPI Formula
-
KPI Definition
-
KPI Type (LTB or UTB)
This feature ensures that users understand how each KPI works.
Back Button Navigation
To return to the main page, users simply click the Back Button located in the top-left corner.
Data Source of the Dashboard
The dashboard uses Excel as the data source. Therefore, users can easily update data without modifying the Power BI file.
The Excel file includes three worksheets.
1. Input_Actual Sheet
In this worksheet, users enter actual KPI values.
Required fields include:
-
KPI Name
-
Month (first date of month)
-
MTD Value
-
YTD Value
These values represent actual performance data.
2. Input_Target Sheet
Click to Purchases Outsourced Accounting KPI Dashboard in Power BI
In this worksheet, users enter target KPI values.
Required fields include:
-
KPI Name
-
Month
-
Target MTD
-
Target YTD
These targets help evaluate whether performance meets expectations.
3. KPI Definition Sheet
This worksheet stores KPI metadata and definitions.
Users must enter:
-
KPI Number
-
KPI Group
-
KPI Name
-
Unit
-
Formula
-
Definition
-
KPI Type (LTB or UTB)
This sheet ensures proper KPI documentation.
Advantages of Outsourced Accounting KPI Dashboard in Power BI
Organizations gain many benefits when they implement this dashboard.
1. Real-Time Performance Monitoring
Managers can track accounting performance instantly. Consequently, decision-making becomes faster.
2. Improved Operational Transparency
The dashboard displays clear KPI comparisons. Therefore, organizations can easily identify underperforming areas.
3. Better Financial Control
Companies can monitor accounting operations closely. As a result, they reduce errors and improve financial accuracy.
4. Enhanced Productivity
Teams can see their performance results clearly. Consequently, employees remain motivated and focused.
5. Faster Reporting
The dashboard eliminates manual reporting processes. Therefore, managers can generate insights instantly.
Best Practices for the Outsourced Accounting KPI Dashboard in Power BI
To maximize the value of this dashboard, organizations should follow certain best practices.
1. Define Clear KPIs
Organizations must define measurable KPIs such as:
-
Invoice processing time
-
Payment accuracy rate
-
Collection efficiency
-
Cost per transaction
Clear KPIs ensure meaningful analysis.
2. Update Data Regularly
Managers should update Excel data frequently. Consequently, the dashboard always displays accurate insights.
3. Use Standard KPI Definitions
Companies should standardize KPI definitions. Therefore, teams can interpret metrics consistently.
4. Monitor Trends Regularly
Managers should analyze KPI trends weekly or monthly. As a result, they can detect problems early.
5. Train Users Properly
Organizations should train employees to use the dashboard effectively. Consequently, teams can leverage analytics fully.
Who Can Benefit from the Outsourced Accounting KPI Dashboard?
Click to Purchases Outsourced Accounting KPI Dashboard in Power BI
Several professionals can benefit from this dashboard.
Accounting Firms
Accounting firms can track team productivity and service quality.
Outsourcing Companies
BPO and KPO companies can monitor operational efficiency.
Finance Managers
Finance leaders can evaluate performance and control accounting operations.
Business Owners
Entrepreneurs can monitor outsourced accounting services easily.
CFOs and Financial Controllers
Executives can track financial performance and improve strategic planning.
How Does This Dashboard Improve Decision-Making?
The Outsourced Accounting KPI Dashboard in Power BI transforms raw accounting data into insights.
Managers can quickly identify:
-
Which KPIs meet targets
-
Which KPIs miss targets
-
Which areas require improvement
-
Which teams perform well
Consequently, leaders can make faster and more accurate business decisions.
Moreover, the dashboard supports performance benchmarking and strategic planning.
Conclusion
Managing outsourced accounting operations requires clear performance visibility and accurate analytics. However, manual spreadsheets and scattered reports often limit decision-making.
Therefore, organizations increasingly rely on Power BI dashboards.
The Outsourced Accounting KPI Dashboard in Power BI provides a powerful solution for monitoring accounting performance. It centralizes KPI tracking, visualizes trends, and simplifies data analysis.
Moreover, the dashboard offers interactive filtering, KPI comparisons, and performance indicators. As a result, managers can monitor service quality, improve productivity, and make better decisions.
Therefore, businesses that adopt this dashboard can enhance transparency, optimize outsourcing operations, and drive financial performance.
Frequently Asked Questions (FAQs)
1. What is an Outsourced Accounting KPI Dashboard?
An Outsourced Accounting KPI Dashboard is a performance monitoring tool that tracks accounting service metrics such as productivity, accuracy, and efficiency.
2. Why should companies use Power BI for KPI dashboards?
Power BI provides powerful visualization, interactive filters, and real-time analytics. Therefore, organizations can analyze data more effectively.
3. What types of KPIs can be tracked in this dashboard?
Examples include:
-
Invoice processing time
-
Accounts payable cycle time
-
Payment accuracy rate
-
Collection efficiency
-
Cost per transaction
-
Click to Purchases Outsourced Accounting KPI Dashboard in Power BI
4. Can this dashboard use Excel as a data source?
Yes. This dashboard uses Excel as the data source. Therefore, users can update data easily without modifying the Power BI file.
5. What does LTB and UTB mean in KPIs?
-
LTB (Lower the Better) means lower values represent better performance.
-
UTB (Upper the Better) means higher values represent better performance.
6. How often should KPI dashboards be updated?
Organizations should update KPI dashboards weekly or monthly depending on reporting requirements.
Visit our YouTube channel to learn step-by-step video tutorials