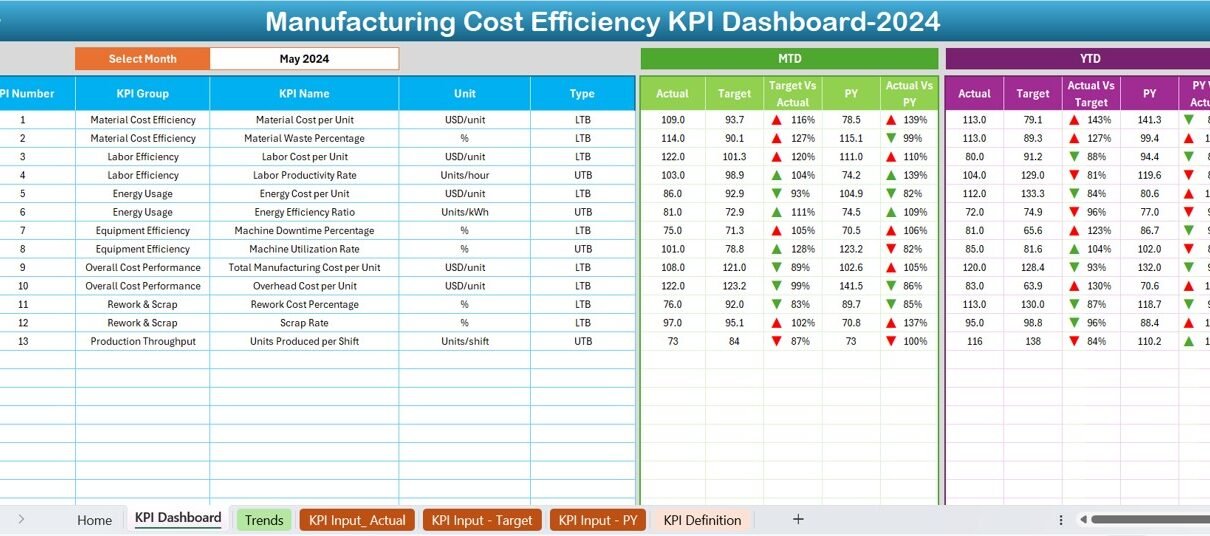
In this article you will learn how use Drill through in Power BI. You can create a page in your report that focuses on a specific entity such as Supervisor
In this article you will learn how to customize Tooltip in Power BI and how to use a Report page as tooltip in Power BI, Tooltip is very useful feature
PKComments Off on Fully Functional Dynamic Calendar Control in VBA
Ah, The complexities of automation! The versatile and multifaceted world of Excel VBA offers an array of tools and functionalities to streamline tasks and make life easier. Yet, despite its
PKComments Off on Highlight Unmatched Cells using Conditional Formatting in Excel
In this article you will learn how to highlight the Unmatched Cells values from another range using Conditional formatting. For Example, we have Sales and Product Master worksheets. In the
PKComments Off on Highlight the Consecutive Duplicates in Excel
In this article you will learn how to highlight the Consecutive Duplicates in Excel using Conditional Formatting. You will also learn how to highlight consecutive weekly off in an Attendance
PKComments Off on UDF for Evaluate a Formula in Excel
In this article you will learn how to create a User Defined Function to evaluate a formula in Excel. You will also learn how to get text of formula using
PKComments Off on VBA: Quickly merge cells with same value in Excel
In this article you will learn how to quickly merge same cells in Excel using VBA. Using this VBA code, you can merge multiple columns data together. This trick can
In today's world, data visualization has become an essential part of business presentations and reporting. It helps to communicate complex information in a simple and visually appealing way. One of
PKComments Off on Data Consolidation: Allow User to select files on Runtime
In this article, we will explain to you the Data Consolidation from multiple Excel files using Application.GetOpenFileName in VBA. You can easily allow the user to select multiple excel files
PKComments Off on Info-graphics: Stunning Thermometer Chart in Excel
I am back with one more innovative chart which is a Stunning Thermometer Chart. This chart can be used for display KPI metrics. You can display your data by category
This website uses cookies to improve your user experience, analyze site traffic and serve targeted ads in accordance with our Privacy PolicyACCEPT
Privacy & Cookies Policy
Privacy Overview
This website uses cookies to improve your experience while you navigate through the website. Out of these cookies, the cookies that are categorized as necessary are stored on your browser as they are essential for the working of basic functionalities of the website. We also use third-party cookies that help us analyze and understand how you use this website. These cookies will be stored in your browser only with your consent. You also have the option to opt-out of these cookies. But opting out of some of these cookies may have an effect on your browsing experience.
Necessary cookies are absolutely essential for the website to function properly. This category only includes cookies that ensures basic functionalities and security features of the website. These cookies do not store any personal information.
Any cookies that may not be particularly necessary for the website to function and is used specifically to collect user personal data via analytics, ads, other embedded contents are termed as non-necessary cookies. It is mandatory to procure user consent prior to running these cookies on your website.