Independent filmmaking is a creative journey filled with passion, risk, and constant financial pressure. Filmmakers must manage limited budgets, control production costs, monitor marketing spend, and still aim for strong box office or festival returns. Therefore, relying on scattered spreadsheets or manual calculations often leads to confusion and missed opportunities.
That is exactly where an Independent Filmmaking Dashboard in Excel becomes a powerful solution.
In this detailed and SEO-friendly guide, you will learn what an Independent Filmmaking Dashboard in Excel is, why it matters, how it works, page-wise dashboard structure, key insights, advantages, best practices, and frequently asked questions. Moreover, this article uses simple language, smooth transitions, and practical explanations so that filmmakers, producers, and analysts can use it easily.
Click to Purchases Independent Filmmaking Dashboard in Excel
What Is an Independent Filmmaking Dashboard in Excel?
An Independent Filmmaking Dashboard in Excel is a ready-to-use analytical template that helps track and analyze financial and performance data related to independent film projects.
Instead of maintaining multiple files for production budgets, marketing expenses, revenue sources, and profitability, this dashboard consolidates everything into one interactive Excel file. As a result, filmmakers gain instant visibility into costs, revenue, profit, and return on investment (ROI).
Because the dashboard is built using Microsoft Excel, it remains affordable, flexible, and accessible even for small production teams.
Why Do Independent Filmmakers Need a Dashboard?
Independent filmmaking involves tight margins and high uncertainty. Therefore, every financial decision matters.
Key Reasons to Use an Independent Filmmaking Dashboard
-
To track total production and marketing costs accurately
-
To monitor revenue from box office, festivals, and distribution channels
-
To measure profit and ROI clearly
-
To compare performance across genres, regions, and channels
-
To support data-driven production and distribution decisions
Moreover, a dashboard replaces guesswork with clarity and confidence.
Click to Purchases Independent Filmmaking Dashboard in Excel
How Does the Independent Filmmaking Dashboard in Excel Work?
The dashboard follows a simple and logical workflow.
-
Users enter film-related data into a structured data sheet
-
Excel formulas calculate totals, profit, and ROI automatically
-
Pivot tables summarize data by genre, channel, region, and month
-
Interactive slicers filter data instantly
-
Charts and KPI cards update automatically
Because of this structure, users save time and reduce manual errors.
What Are the Key Features of the Independent Filmmaking Dashboard?
This dashboard includes five analytical pages, supported by a data sheet, all designed to deliver meaningful insights.
How Does the Page Navigator Improve Usability?
The Page Navigator, located on the left side, allows users to move easily between different analytical pages.
Benefits of the Page Navigator
-
One-click navigation
-
Clear dashboard structure
-
Improved user experience
As a result, users explore insights quickly without scrolling or confusion.
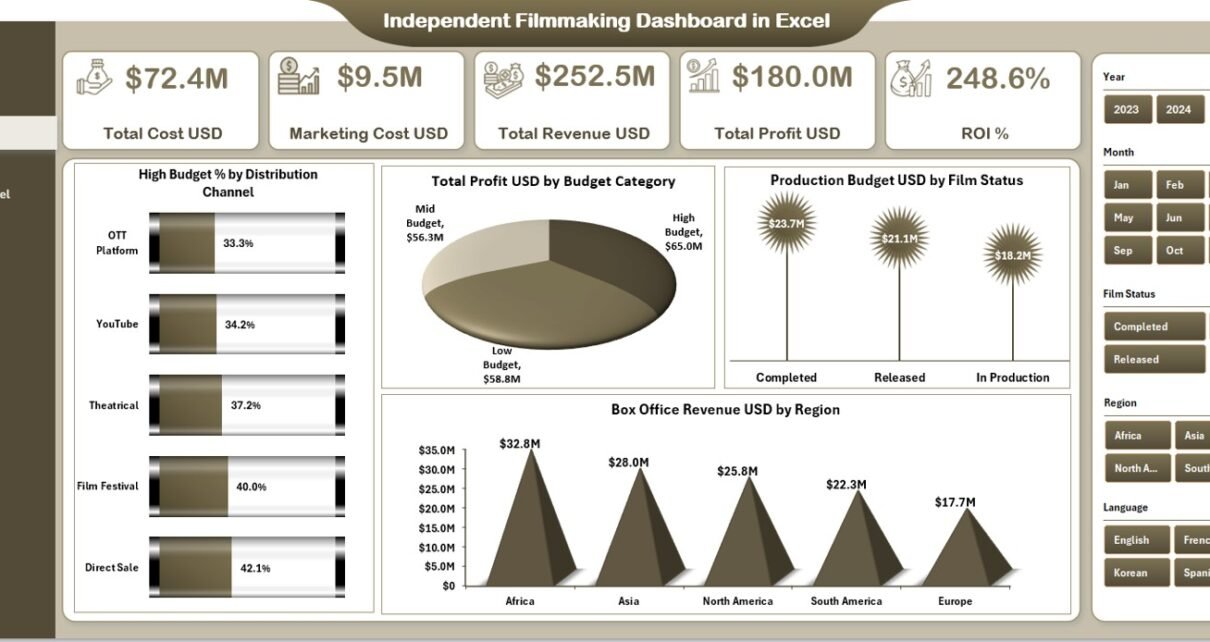
What Does the Overview Page Show?
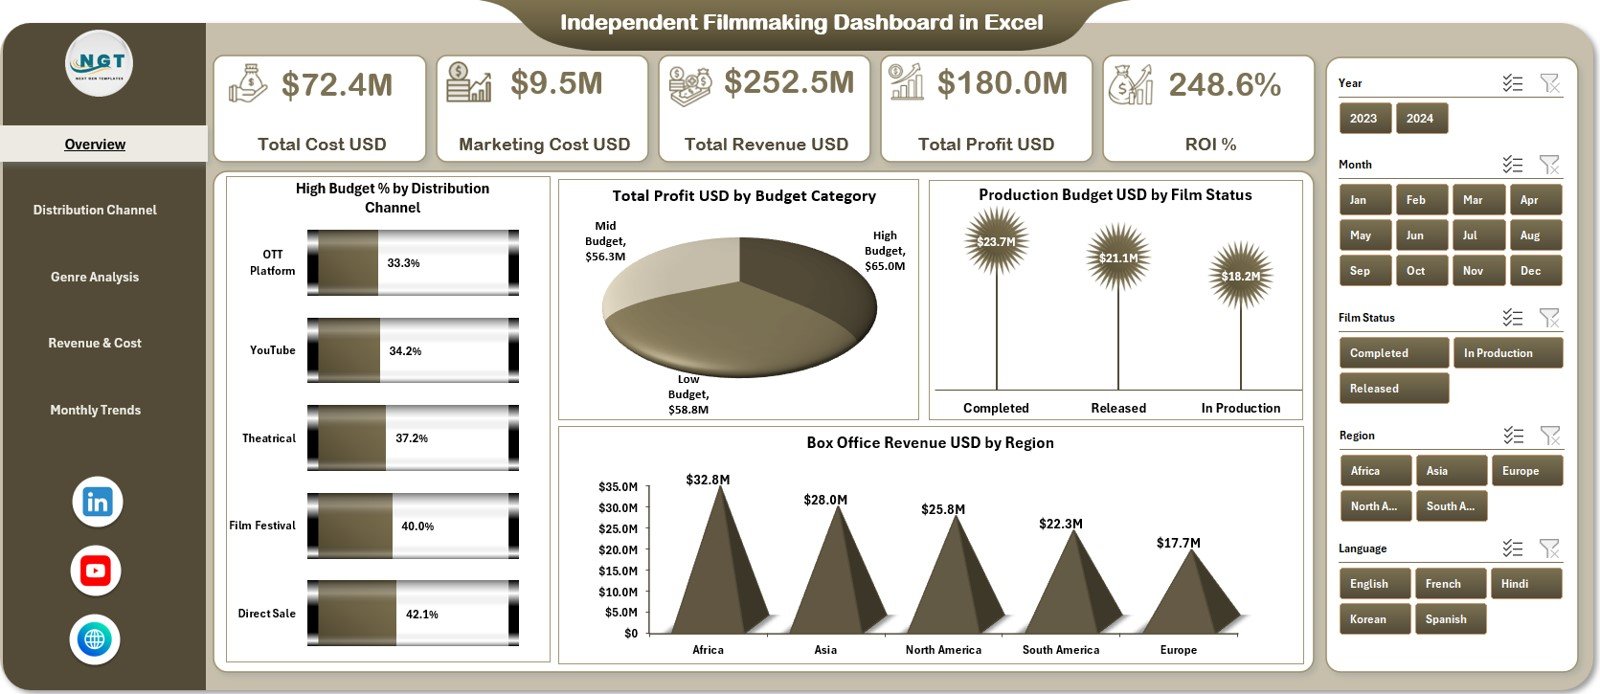
The Overview Page acts as the central snapshot of filmmaking performance.
KPI Cards on the Overview Page
The dashboard displays five key KPI cards:
-
Total Cost USD – Overall production and operational cost
-
Marketing Cost USD – Total promotional and distribution spend
-
Total Revenue USD – Revenue from box office, festivals, and channels
-
Total Profit USD – Revenue minus total cost
-
ROI % – Return on investment percentage
These cards provide an instant understanding of the film’s financial health.
Charts on the Overview Page
The Overview Page also includes four insightful charts:
-
High Budget % by Distribution Channel
-
Total Profit USD by Budget Category
-
Production Budget USD by Film Status
-
Box Office Revenue USD by Region
Together, these visuals highlight where money is spent and where returns come from.
Click to Purchases Independent Filmmaking Dashboard in Excel
What Insights Does the Distribution Channel Analysis Page Provide?
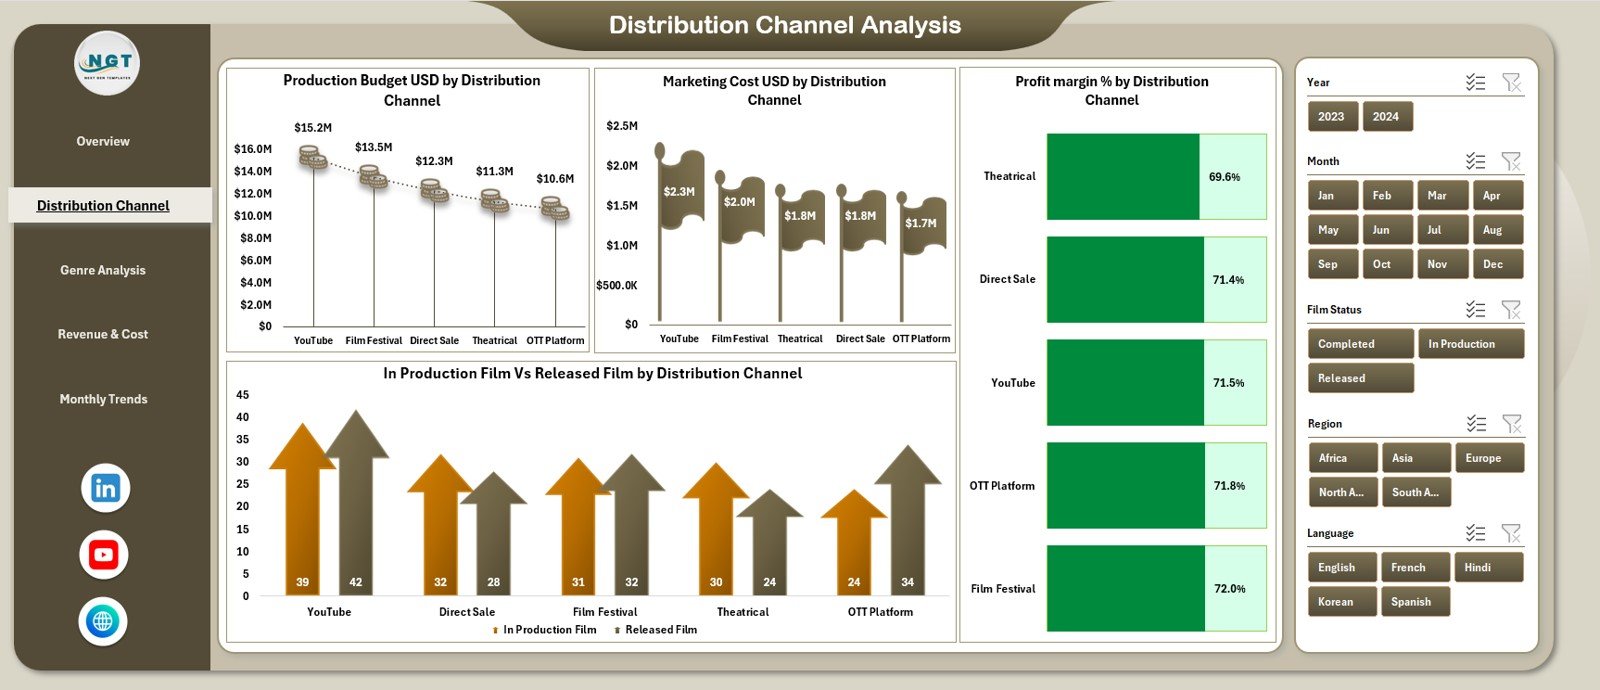
The Distribution Channel Analysis page focuses on performance across different distribution platforms.
Key Charts on This Page
-
Production Budget USD by Distribution Channel
-
Marketing Cost USD by Distribution Channel
-
Profit Margin % by Distribution Channel
-
In-Production Films vs Released Films by Distribution Channel
These insights help filmmakers identify which channels deliver the best returns.
Why Is Distribution Channel Analysis Important?
Distribution decisions directly impact revenue potential. Therefore, this page helps filmmakers:
-
Allocate budgets more effectively
-
Reduce spending on low-performing channels
-
Focus on high-ROI platforms
What Does the Genre Analysis Page Reveal?
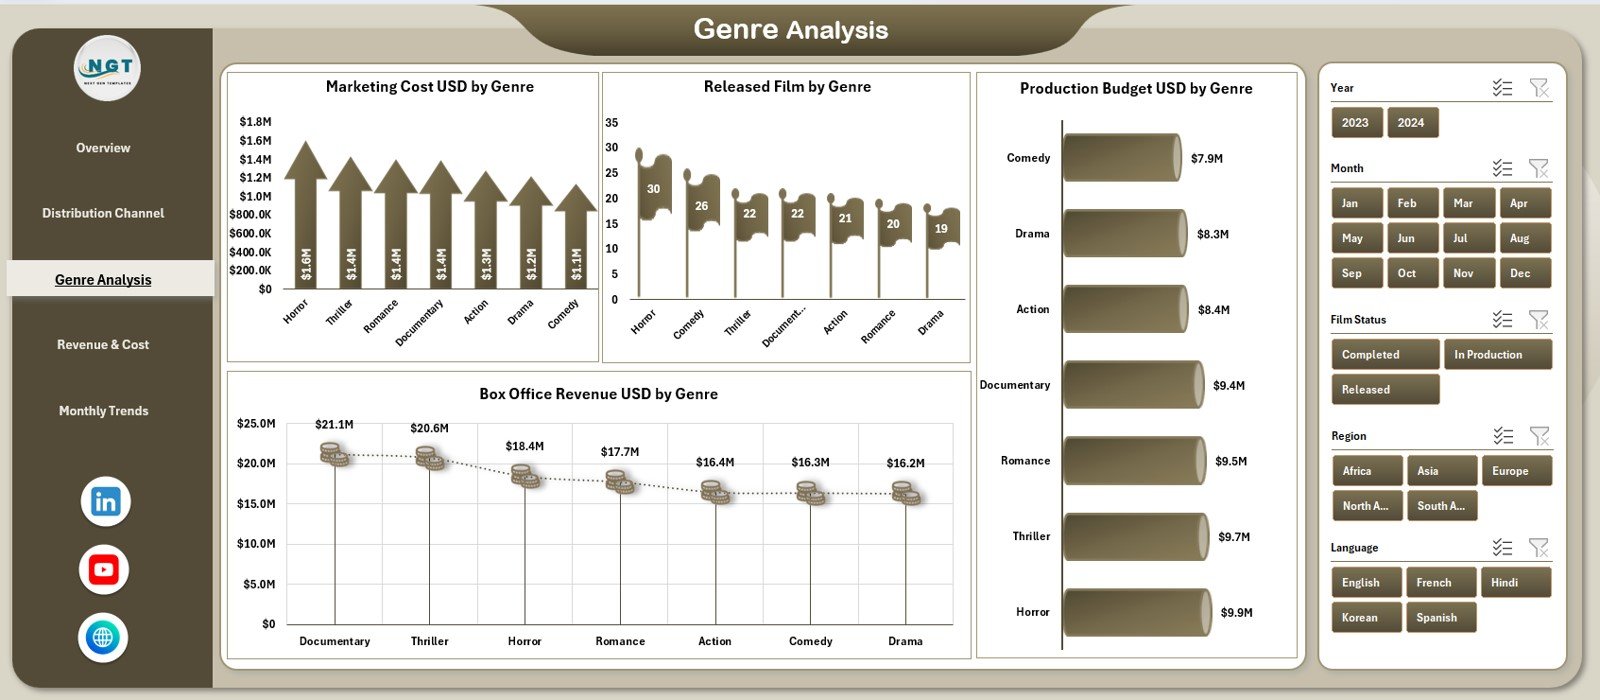
The Genre Analysis page evaluates performance by film genre.
Charts Included on the Genre Analysis Page
-
Marketing Cost USD by Genre
-
Released Films by Genre
-
Box Office Revenue USD by Genre
-
Production Budget USD by Genre
These visuals reveal which genres attract audiences and generate revenue.
How Does Genre Analysis Support Creative Decisions?
By analyzing genre-level performance, filmmakers can:
-
Choose genres with strong audience demand
-
Balance creative passion with financial viability
-
Optimize future project planning
What Is Covered in the Revenue & Cost Analysis Page?
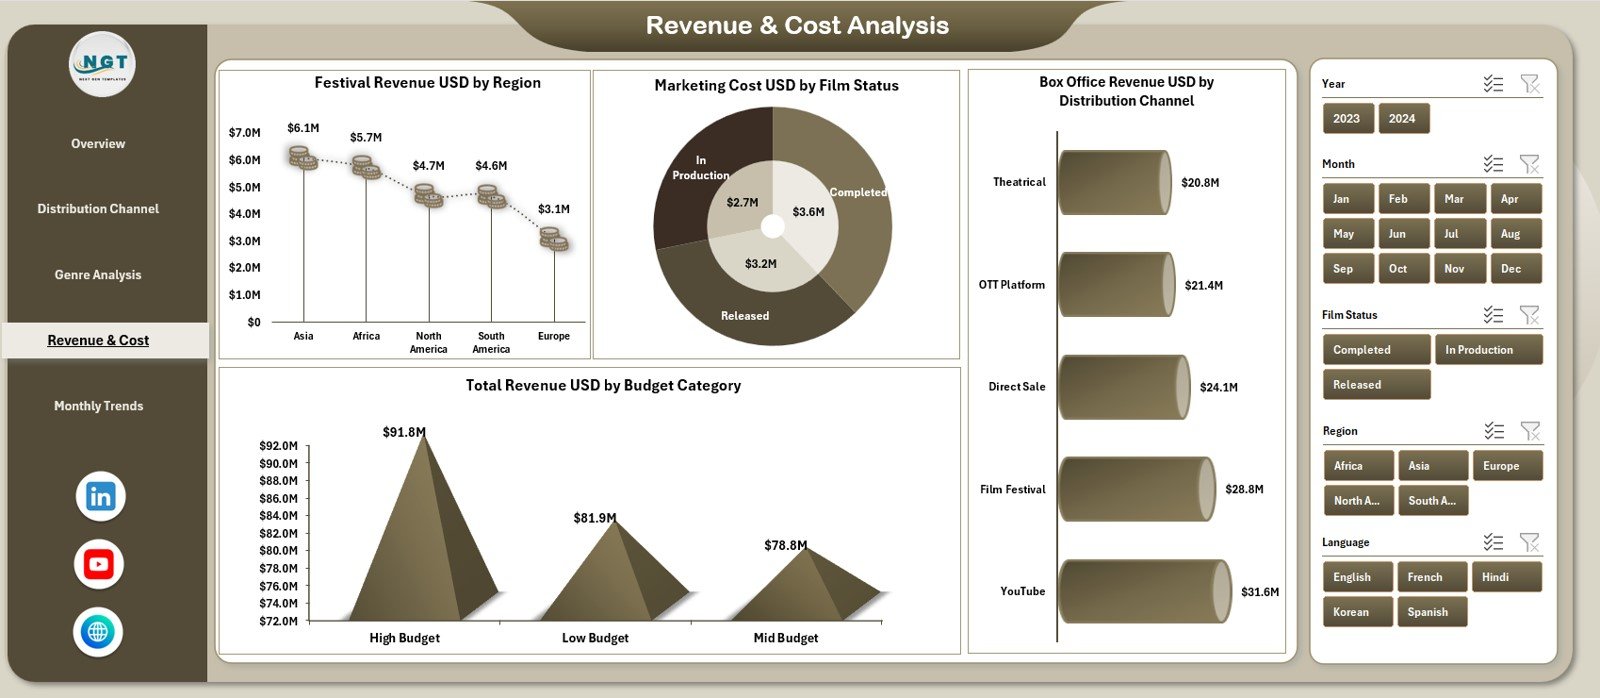
The Revenue & Cost Analysis page focuses on detailed financial breakdowns.
Charts on the Revenue & Cost Analysis Page
-
Festival Revenue USD by Region
-
Marketing Cost by Film Status
-
Total Revenue USD by Budget Category
-
Box Office Revenue USD by Distribution Channel
This page helps users understand how revenue streams and costs interact.
Why Is Revenue and Cost Analysis Crucial?
Independent films often rely on multiple revenue sources. Therefore, understanding cost-to-revenue relationships helps improve profitability and sustainability.
What Insights Does the Monthly Trends Page Offer?
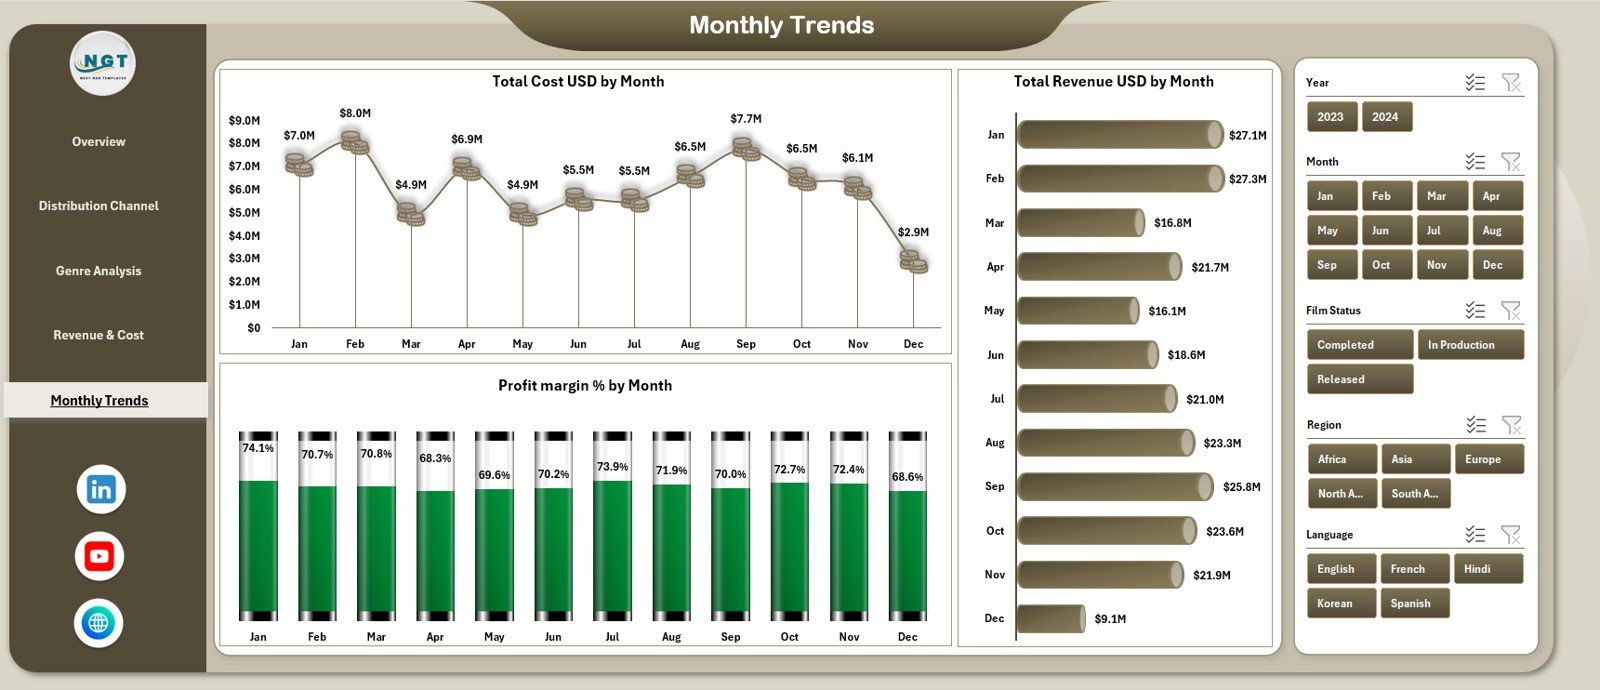
The Monthly Trends page focuses on time-based performance.
Charts on the Monthly Trends Page
-
Total Cost USD by Month
-
Total Revenue USD by Month
-
Profit Margin % by Month
These charts reveal seasonality, growth patterns, and financial stability.
How Do Monthly Trends Support Planning?
By reviewing monthly trends, filmmakers can:
-
Identify peak revenue periods
-
Control cost spikes
-
Plan releases and marketing campaigns strategically
What Is the Role of the Data Sheet?
The Data Sheet acts as the foundation of the dashboard.
Information Stored in the Data Sheet
-
Film name
-
Genre
-
Budget category
-
Production budget
-
Marketing cost
-
Revenue by source
-
Film status (In Production or Released)
-
Distribution channel
-
Region
-
Month
Because data remains structured, pivot tables and charts work seamlessly.
Advantages of Independent Filmmaking Dashboard in Excel
1. Centralized Financial Visibility
The dashboard brings all film-related financial data into one place.
2. Easy to Use and Update
Because it runs in Excel, users do not need advanced technical skills.
3. Better Budget Control
Visual insights help prevent overspending and budget overruns.
4. Improved Profitability Analysis
Profit and ROI calculations help measure financial success clearly.
5. Smarter Distribution Decisions
Channel-level insights guide distribution strategy.
6. Cost-Effective Analytics Solution
The dashboard avoids expensive software while delivering strong analytical power.
Who Should Use an Independent Filmmaking Dashboard?
This dashboard suits a wide range of users, including:
-
Independent filmmakers
-
Film producers
-
Production managers
-
Film finance teams
-
Film investors and stakeholders
Because of its intuitive design, both creative and financial teams can use it confidently.
Click to Purchases Independent Filmmaking Dashboard in Excel
Best Practices for the Independent Filmmaking Dashboard in Excel
1. Maintain Accurate Data Entry
Always enter correct budget, cost, and revenue data to ensure reliable insights.
2. Update Data Regularly
Update the dashboard monthly or after major financial events.
3. Categorize Films Properly
Use consistent genre, budget category, and channel names.
4. Review ROI Alongside Profit
Profit alone does not tell the full story. Always analyze ROI percentage.
5. Focus on Trends, Not Just Totals
Use monthly trends to understand long-term performance patterns.
6. Use Insights for Future Projects
Apply dashboard learnings when planning new film projects.
What Challenges Does This Dashboard Solve?
-
Scattered financial tracking
-
Manual and error-prone calculations
-
Lack of visibility into profitability
-
Difficulty comparing channels and genres
-
Limited insight into revenue trends
Because of its structured design, the dashboard addresses these challenges effectively.
How Does This Dashboard Support Strategic Filmmaking Decisions?
By combining cost, revenue, profit, and ROI data, the dashboard supports:
-
Smarter budget allocation
-
Better distribution planning
-
Data-backed genre selection
-
Investor reporting and transparency
As a result, filmmakers gain stronger control over both creative and financial outcomes.
Conclusion
An Independent Filmmaking Dashboard in Excel provides a powerful yet practical way to manage film finances and performance. Instead of relying on disconnected spreadsheets, filmmakers gain a centralized, visual, and data-driven decision-making tool.
With interactive KPIs, insightful charts, and clear trends, this dashboard helps independent filmmakers control costs, maximize revenue, and improve ROI. Therefore, any filmmaker serious about sustainable success should adopt this dashboard.
Click to Purchases Independent Filmmaking Dashboard in Excel
Frequently Asked Questions (FAQs)
What is an Independent Filmmaking Dashboard in Excel?
It is an Excel-based dashboard that tracks film budgets, costs, revenue, profit, and ROI using interactive visuals.
Can I use this dashboard for multiple films?
Yes, the dashboard supports analysis across multiple films, genres, and channels.
Does the dashboard require advanced Excel skills?
No, basic Excel knowledge is sufficient to use and update the dashboard.
Can I customize charts and KPIs?
Yes, you can easily modify KPIs, charts, and categories to suit your project needs.
Is this dashboard suitable for low-budget films?
Yes, it is especially useful for low-budget and independent film projects.
How often should I update the dashboard?
You should update it monthly or whenever new cost or revenue data becomes available.
Click to Purchases Independent Filmmaking Dashboard in Excel
Visit our YouTube channel to learn step-by-step video tutorials