New: NextGenTemplates Academy - video courses on Excel formulas with AI and Pivot Tables & dashboards. Early-bird: 20% off with code EARLYBIRD20 - first 20 orders only. See the courses →
  • Learn Excel (Free Course)
    • 1. Shortcut Keys
    • 2. Fill & Flash Fill
    • 3. Find & Replace
    • 4. Sort & Filter
    • 5. Formulas & Functions
    • 6. Data Validation
    • 7. Conditional Formatting
    • 8. Basic Charts
    • 9. Advanced Charts
    • 10. Pivot Tables
    • 11. Excel Dashboards
    • 12. VBA Course
    • 13. Excel Formulas with AI
  • Templates
  • Tutorials
    • Charts and Visualization
    • VBA
    • Excel Tips and Tricks
    • Excel Dashboards
    • Power Pivot & DAX
  • Power BI
  • Template Store
    • Ready to Use Templates
  • Courses
  • Academy
    • Excel + AI Mastery: 100 Formulas
    • Excel Pivot Tables & Dashboards
  • About Us
  • Contact Us

PK: An Excel Expert

Transforming Data into Decisions

Tag: Academic Dashboard

Dashboard

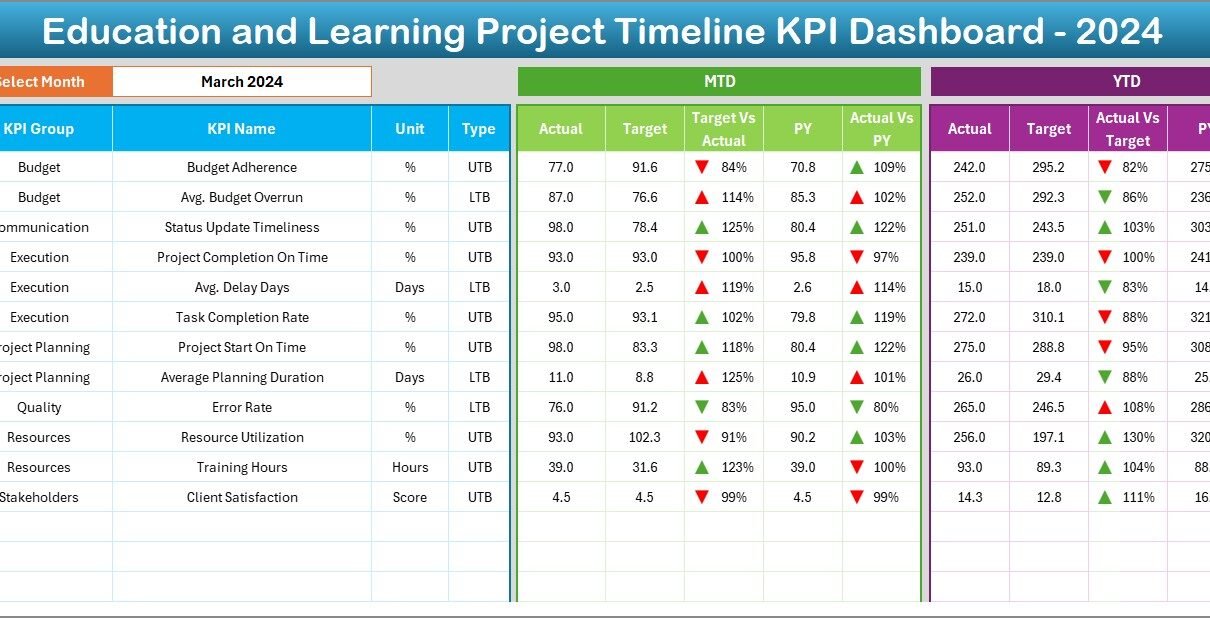
Education and Learning Project Timeline KPI Dashboard in Excel

June 8, 2025June 8, 2025 PKComments Off on Education and Learning Project Timeline KPI Dashboard in Excel
In today’s fast-paced academic and training environments, tracking progress across multiple projects isn’t just beneficial—it’s essential. Whether you’re managing curriculum development, teacher training, or institutional growth initiatives, having a clear
Read More
Dashboard

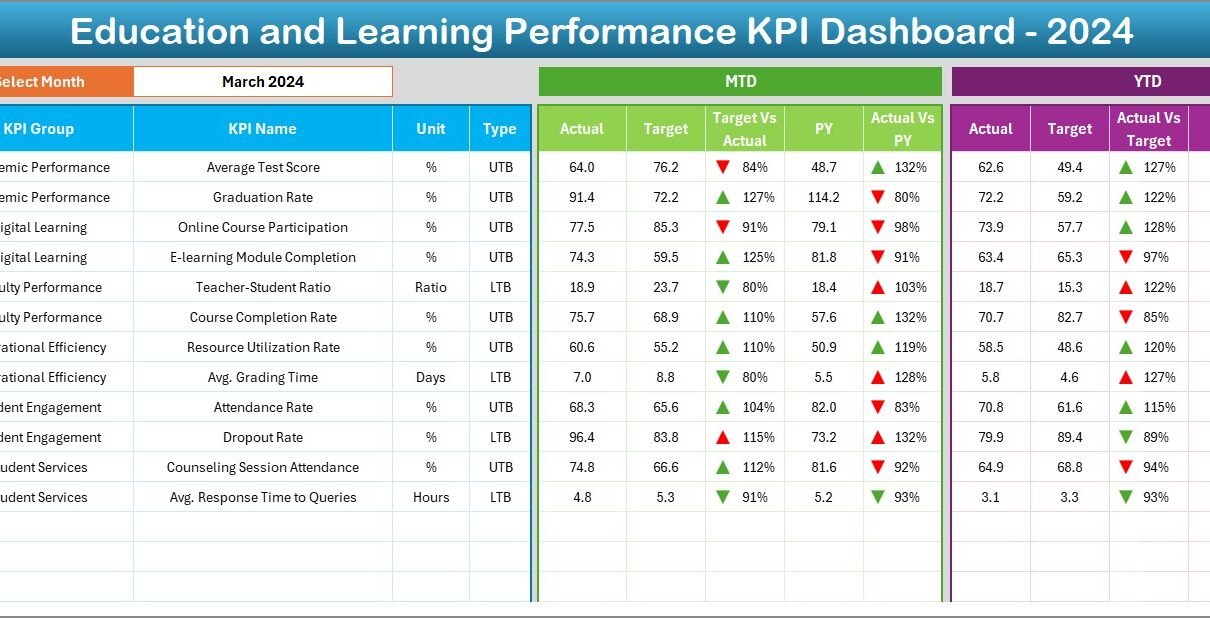
Education and Learning Performance KPI Dashboard in Excel

May 30, 2025May 30, 2025 PKComments Off on Education and Learning Performance KPI Dashboard in Excel
In today's data-driven education landscape, institutions must continuously evaluate and improve their performance. Whether you're running a school, university, training center, or e-learning platform, tracking the right Key Performance Indicators
Read More
Dashboard

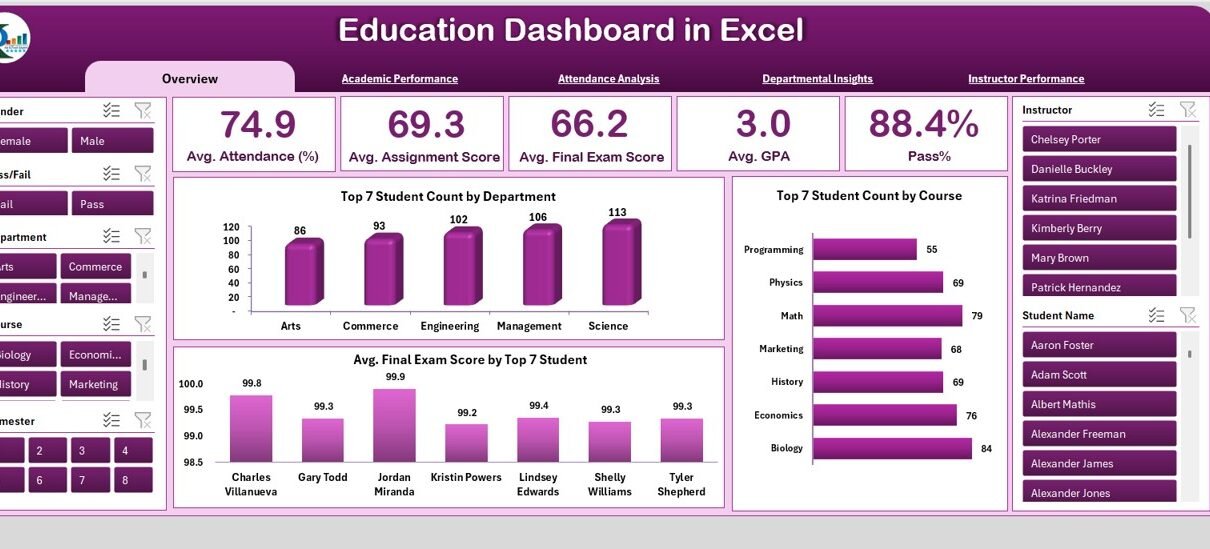
Education Dashboard in Excel

April 16, 2025April 17, 2025 PKComments Off on Education Dashboard in Excel
An Education Dashboard in Excel provides a powerful way to track and visualize academic performance, attendance, and other key data points. By using Excel's built-in features like charts, slicers, and
Read More

Posts pagination

Previous 1 2
  • Learn Excel (Free Course)
    • 1. Shortcut Keys
    • 2. Fill & Flash Fill
    • 3. Find & Replace
    • 4. Sort & Filter
    • 5. Formulas & Functions
    • 6. Data Validation
    • 7. Conditional Formatting
    • 8. Basic Charts
    • 9. Advanced Charts
    • 10. Pivot Tables
    • 11. Excel Dashboards
    • 12. VBA Course
    • 13. Excel Formulas with AI
  • Templates
  • Tutorials
    • Charts and Visualization
    • VBA
    • Excel Tips and Tricks
    • Excel Dashboards
    • Power Pivot & DAX
  • Power BI
  • Template Store
    • Ready to Use Templates
  • Courses
  • Academy
    • Excel + AI Mastery: 100 Formulas
    • Excel Pivot Tables & Dashboards
  • About Us
  • Contact Us
Copyright © 2023 PK-AnExcelExpert.com - Privacy Policy