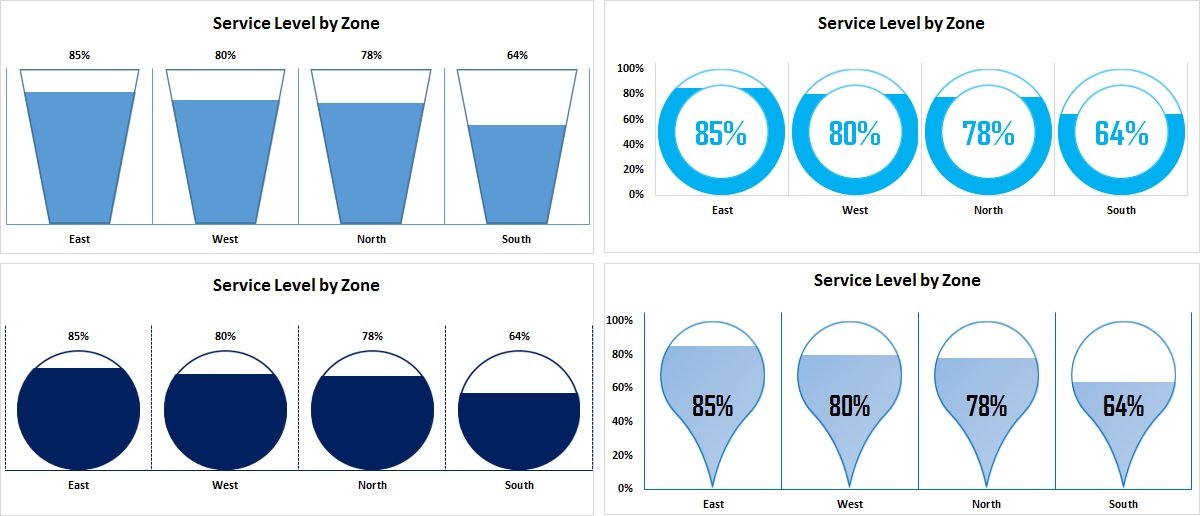
Info-graphics with Column chart (Part-2)
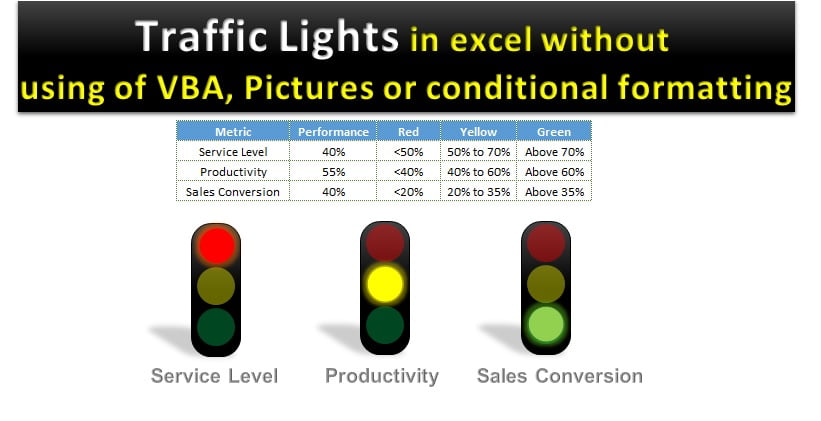
In this article you will learn how we can use info-graphics in the column chart for KPI metrics. We have created 4 different charts for Service Level. These charts can
Transforming Data into Decisions