New: NextGenTemplates Academy - video courses on Excel formulas with AI and Pivot Tables & dashboards. Early-bird: 20% off with code EARLYBIRD20 - first 20 orders only. See the courses →
  • Learn Excel (Free Course)
    • 1. Shortcut Keys
    • 2. Fill & Flash Fill
    • 3. Find & Replace
    • 4. Sort & Filter
    • 5. Formulas & Functions
    • 6. Data Validation
    • 7. Conditional Formatting
    • 8. Basic Charts
    • 9. Advanced Charts
    • 10. Pivot Tables
    • 11. Excel Dashboards
    • 12. VBA Course
    • 13. Excel Formulas with AI
  • Templates
  • Tutorials
    • Charts and Visualization
    • VBA
    • Excel Tips and Tricks
    • Excel Dashboards
    • Power Pivot & DAX
  • Power BI
  • Template Store
    • Ready to Use Templates
  • Courses
  • Academy
    • Excel + AI Mastery: 100 Formulas
    • Excel Pivot Tables & Dashboards
  • About Us
  • Contact Us

PK: An Excel Expert

Transforming Data into Decisions

Tag: Clean Energy Dashboard

Power BI Templates

Geothermal Energy Dashboard in Power BI

June 17, 2026June 17, 2026 PKComments Off on Geothermal Energy Dashboard in Power BI
Geothermal energy teams often manage long-running plant assets, high capital costs, regional operating differences, and sustainability targets at the same time. The Geothermal Energy Dashboard in Power BI gives those
Read More
Clean Tech Dashboard in Power BI - Renewable Energy Portfolio Dashboard
Dashboard Power BI

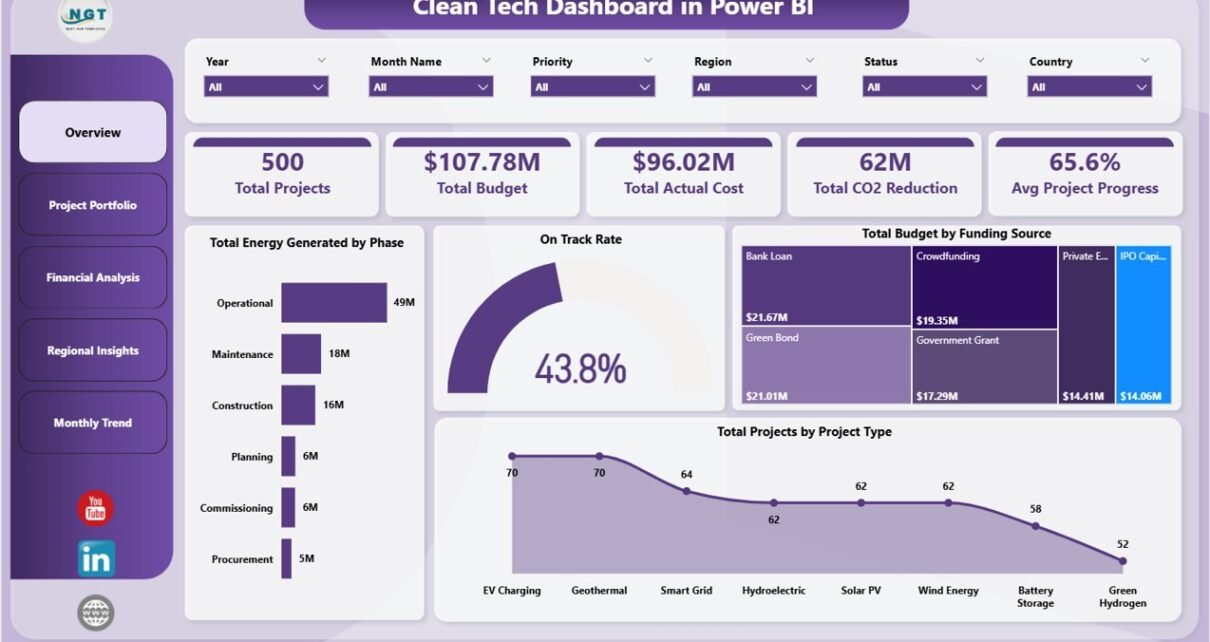
Clean Tech Dashboard in Power BI

May 27, 2026May 27, 2026 PKComments Off on Clean Tech Dashboard in Power BI
The Clean Tech Dashboard in Power BI tracks 5 portfolio-level KPIs across 5 interactive pages, with 13 pre-built charts covering project portfolio, financial performance, regional impact, and monthly trends. Setup
Read More
Dashboard

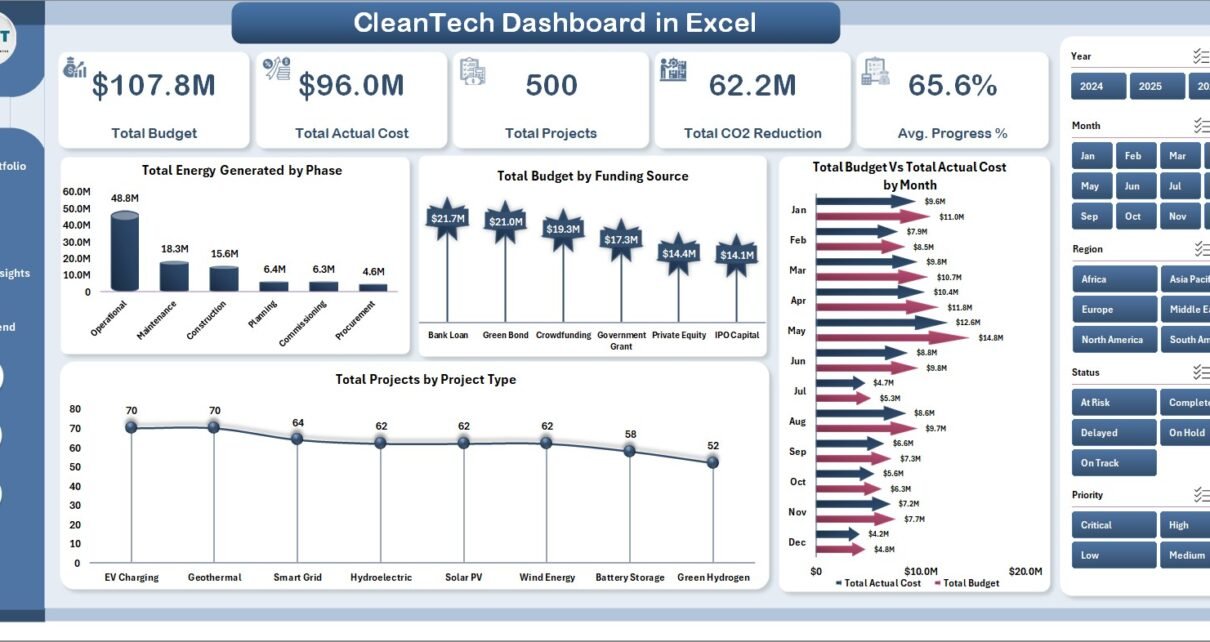
Clean Tech Dashboard in Excel

May 24, 2026May 24, 2026 PKComments Off on Clean Tech Dashboard in Excel
The global clean tech market crossed $1.7 trillion in annual investment in 2024, with renewable energy projects alone accounting for over 540 GW of new capacity additions. Yet most project
Read More
Dashboard Power BI

Biofuels KPI Dashboard in Power BI

January 6, 2026January 6, 2026 PKComments Off on Biofuels KPI Dashboard in Power BI
The biofuels industry plays a vital role in the global shift toward clean and renewable energy. However, as operations grow, tracking performance, meeting targets, and comparing results across months and
Read More
  • Learn Excel (Free Course)
    • 1. Shortcut Keys
    • 2. Fill & Flash Fill
    • 3. Find & Replace
    • 4. Sort & Filter
    • 5. Formulas & Functions
    • 6. Data Validation
    • 7. Conditional Formatting
    • 8. Basic Charts
    • 9. Advanced Charts
    • 10. Pivot Tables
    • 11. Excel Dashboards
    • 12. VBA Course
    • 13. Excel Formulas with AI
  • Templates
  • Tutorials
    • Charts and Visualization
    • VBA
    • Excel Tips and Tricks
    • Excel Dashboards
    • Power Pivot & DAX
  • Power BI
  • Template Store
    • Ready to Use Templates
  • Courses
  • Academy
    • Excel + AI Mastery: 100 Formulas
    • Excel Pivot Tables & Dashboards
  • About Us
  • Contact Us
Copyright © 2023 PK-AnExcelExpert.com - Privacy Policy