New: NextGenTemplates Academy - video courses on Excel formulas with AI and Pivot Tables & dashboards. Early-bird: 20% off with code EARLYBIRD20 - first 20 orders only. See the courses →
  • Learn Excel (Free Course)
    • 1. Shortcut Keys
    • 2. Fill & Flash Fill
    • 3. Find & Replace
    • 4. Sort & Filter
    • 5. Formulas & Functions
    • 6. Data Validation
    • 7. Conditional Formatting
    • 8. Basic Charts
    • 9. Advanced Charts
    • 10. Pivot Tables
    • 11. Excel Dashboards
    • 12. VBA Course
    • 13. Excel Formulas with AI
  • Templates
  • Tutorials
    • Charts and Visualization
    • VBA
    • Excel Tips and Tricks
    • Excel Dashboards
    • Power Pivot & DAX
  • Power BI
  • Template Store
    • Ready to Use Templates
  • Courses
  • Academy
    • Excel + AI Mastery: 100 Formulas
    • Excel Pivot Tables & Dashboards
  • About Us
  • Contact Us

PK: An Excel Expert

Transforming Data into Decisions

Tag: Consulting Analytics

Dashboard

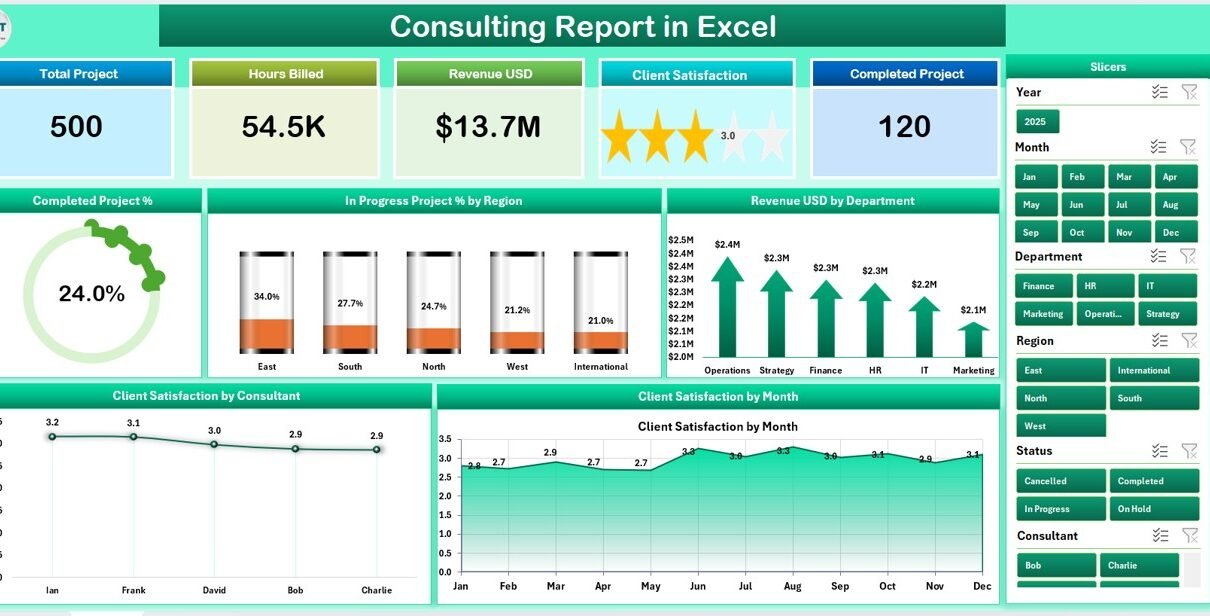
Consulting Report in Excel

April 27, 2026April 27, 2026 PKComments Off on Consulting Report in Excel
The Consulting Report in Excel tracks 5 core consulting KPIs across 4 structured sheets, with 5 pre-built charts and two slicers covering Completed Project %, In Progress Project % by
Read More
Templates

Consulting KPI Dashboard in Power BI

November 17, 2025November 17, 2025 PKComments Off on Consulting KPI Dashboard in Power BI
Every consulting business wants to track performance, improve service delivery, and make informed decisions. However, most teams struggle because they rely on scattered spreadsheets, manual tracking, and inconsistent reporting. A
Read More
Dashboard Power BI

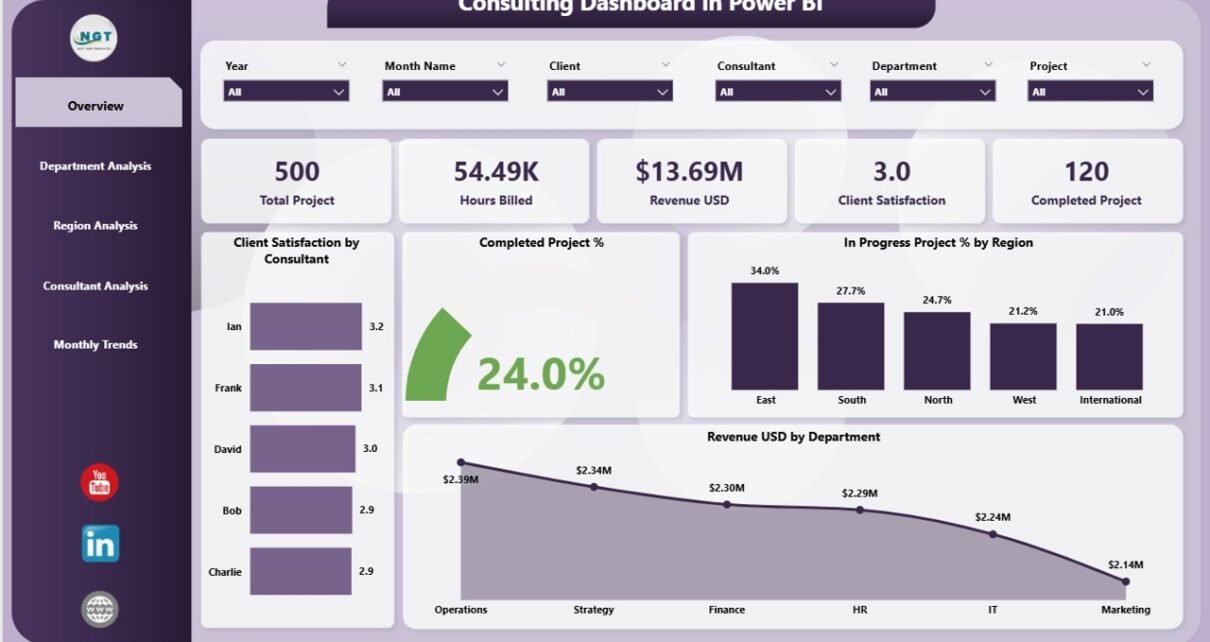
Consulting Dashboard in Power BI

October 25, 2025October 25, 2025 PKComments Off on Consulting Dashboard in Power BI
In today’s consulting world, data drives every decision. Whether you manage clients, projects, or performance metrics, the ability to visualize information clearly determines how effectively your firm operates. That’s where
Read More
Dashboard

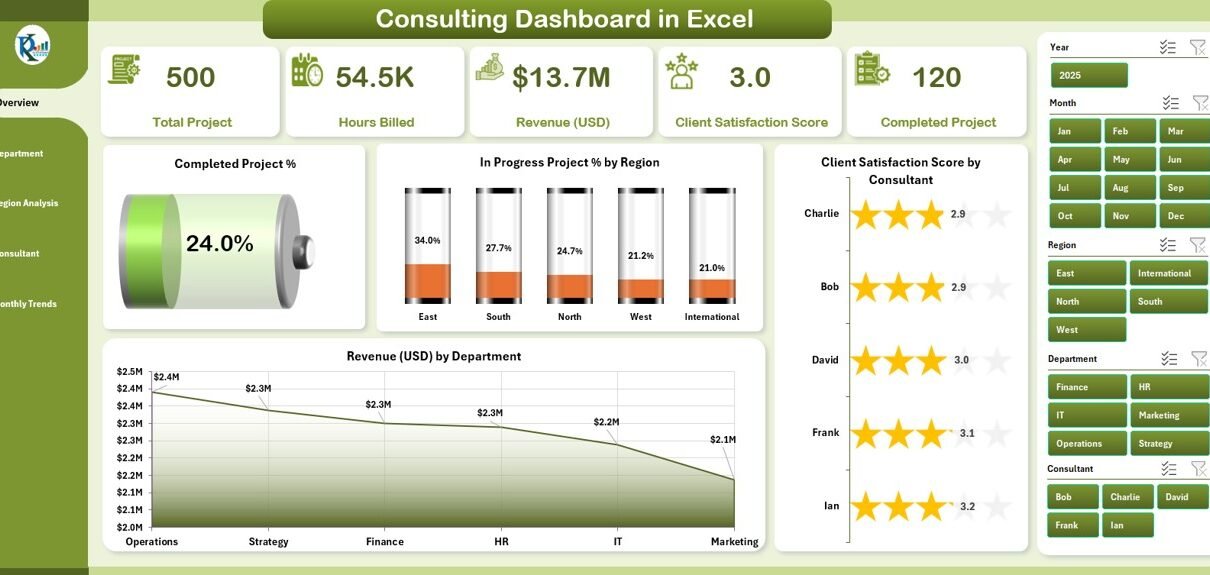
Consulting Dashboard in Excel

September 26, 2025September 26, 2025 PKComments Off on Consulting Dashboard in Excel
Managing consulting projects, tracking client satisfaction, and analyzing revenue trends can become complex when data is scattered across multiple files. A Consulting Dashboard in Excel brings all these insights together
Read More
  • Learn Excel (Free Course)
    • 1. Shortcut Keys
    • 2. Fill & Flash Fill
    • 3. Find & Replace
    • 4. Sort & Filter
    • 5. Formulas & Functions
    • 6. Data Validation
    • 7. Conditional Formatting
    • 8. Basic Charts
    • 9. Advanced Charts
    • 10. Pivot Tables
    • 11. Excel Dashboards
    • 12. VBA Course
    • 13. Excel Formulas with AI
  • Templates
  • Tutorials
    • Charts and Visualization
    • VBA
    • Excel Tips and Tricks
    • Excel Dashboards
    • Power Pivot & DAX
  • Power BI
  • Template Store
    • Ready to Use Templates
  • Courses
  • Academy
    • Excel + AI Mastery: 100 Formulas
    • Excel Pivot Tables & Dashboards
  • About Us
  • Contact Us
Copyright © 2023 PK-AnExcelExpert.com - Privacy Policy