New: NextGenTemplates Academy - video courses on Excel formulas with AI and Pivot Tables & dashboards. Early-bird: 20% off with code EARLYBIRD20 - first 20 orders only. See the courses →
  • Learn Excel (Free Course)
    • 1. Shortcut Keys
    • 2. Fill & Flash Fill
    • 3. Find & Replace
    • 4. Sort & Filter
    • 5. Formulas & Functions
    • 6. Data Validation
    • 7. Conditional Formatting
    • 8. Basic Charts
    • 9. Advanced Charts
    • 10. Pivot Tables
    • 11. Excel Dashboards
    • 12. VBA Course
    • 13. Excel Formulas with AI
  • Templates
  • Tutorials
    • Charts and Visualization
    • VBA
    • Excel Tips and Tricks
    • Excel Dashboards
    • Power Pivot & DAX
  • Power BI
  • Template Store
    • Ready to Use Templates
  • Courses
  • Academy
    • Excel + AI Mastery: 100 Formulas
    • Excel Pivot Tables & Dashboards
  • About Us
  • Contact Us

PK: An Excel Expert

Transforming Data into Decisions

Tag: Cost analysis

Dashboard Power BI

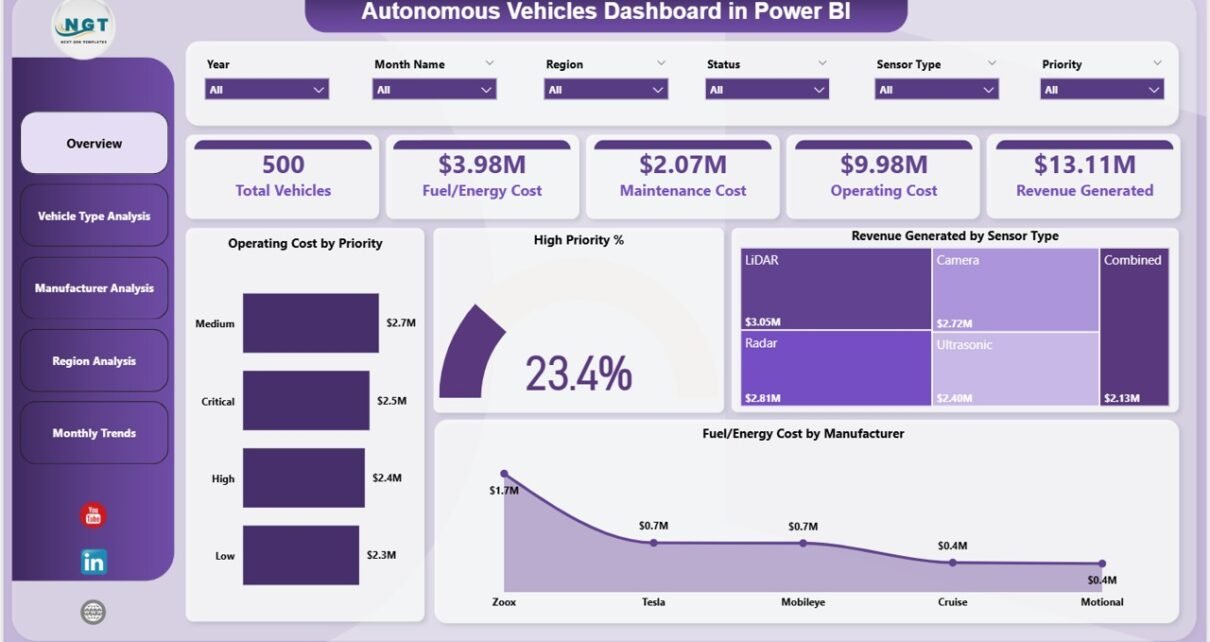
Autonomous Vehicles Dashboard in Power BI

March 22, 2026March 22, 2026 PKComments Off on Autonomous Vehicles Dashboard in Power BI
In today’s fast-evolving mobility industry, autonomous vehicles generate massive amounts of data every second. From fuel consumption to maintenance costs and revenue generation, businesses must manage complex datasets to stay
Read More
Dashboard

Autonomous Vehicles Dashboard in Excel

March 22, 2026March 22, 2026 PKComments Off on Autonomous Vehicles Dashboard in Excel
In today’s rapidly evolving transportation industry, autonomous vehicles are transforming how businesses operate. Companies now rely heavily on data to monitor vehicle performance, track costs, and improve operational efficiency. However,
Read More
Dashboard

Augmented Analytics Dashboard in Excel

March 20, 2026March 20, 2026 PKComments Off on Augmented Analytics Dashboard in Excel
In today’s fast-moving digital world, businesses generate massive amounts of data every single day. However, many organizations still struggle to turn this data into meaningful insights. As a result, decision-making
Read More
Dashboard Power BI

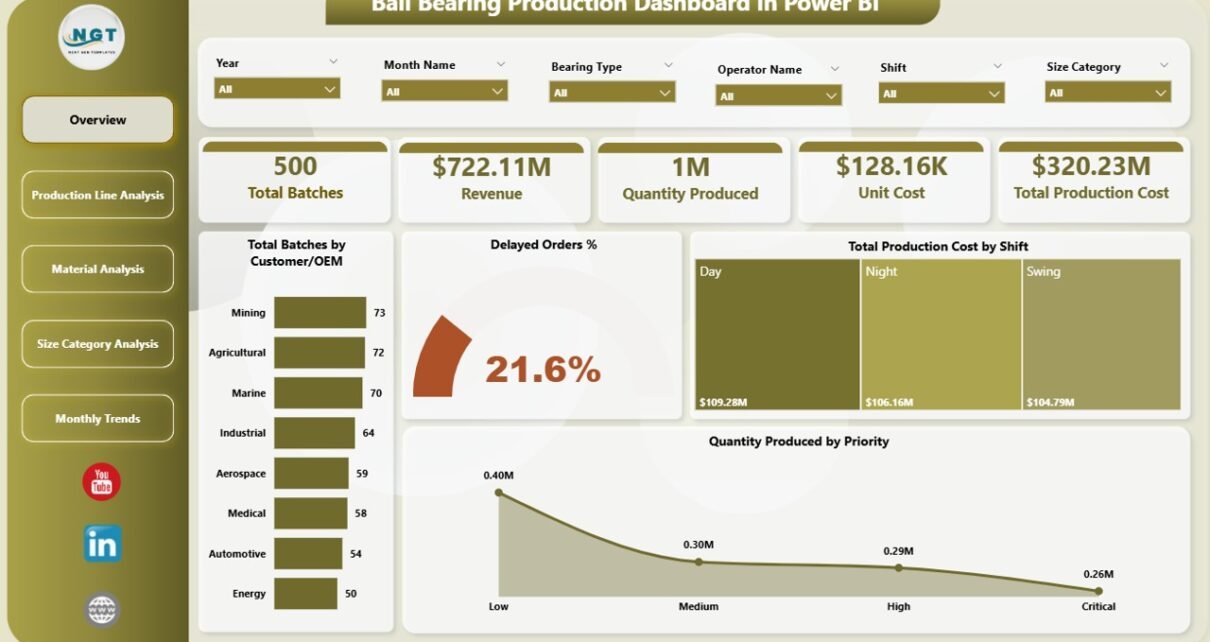
Ball Bearing Production Dashboard in Power BI

March 18, 2026March 18, 2026 PKComments Off on Ball Bearing Production Dashboard in Power BI
In today’s highly competitive manufacturing environment, companies must monitor production performance, control costs, and improve efficiency in real time. However, many ball bearing manufacturers still rely on disconnected spreadsheets and
Read More
Dashboard

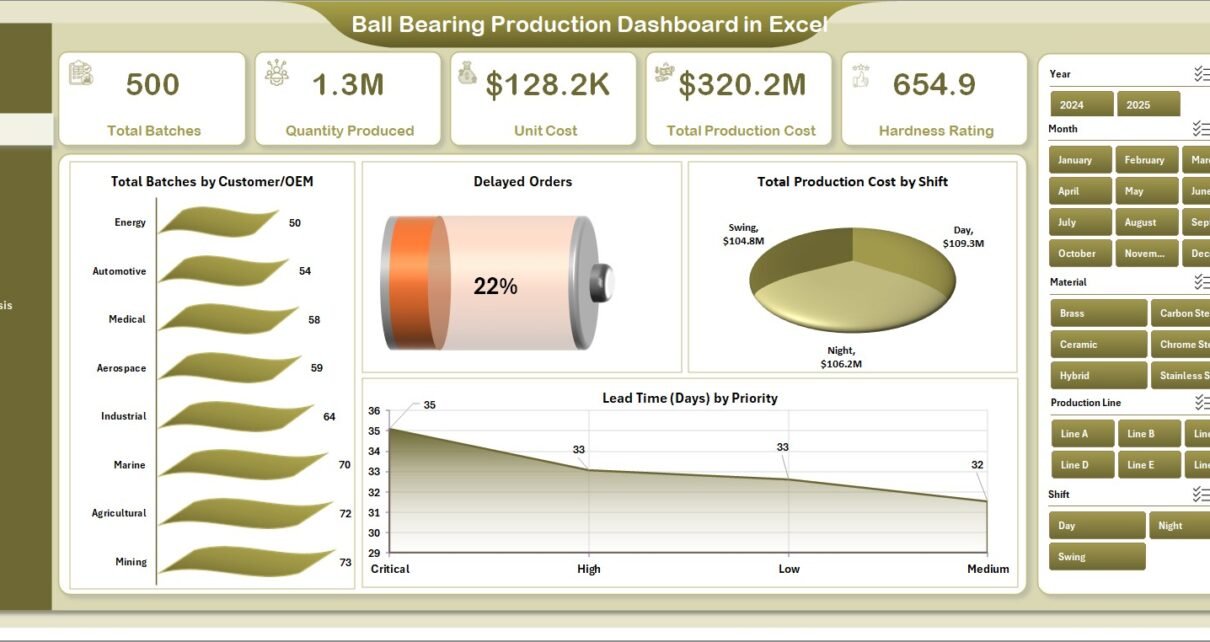
Ball Bearing Production Dashboard in Excel

March 18, 2026March 18, 2026 PKComments Off on Ball Bearing Production Dashboard in Excel
In today’s highly competitive manufacturing industry, precision and efficiency are everything. Especially in industries like automotive, heavy machinery, and industrial equipment, ball bearings play a critical role. However, managing production
Read More
Dashboard Power BI

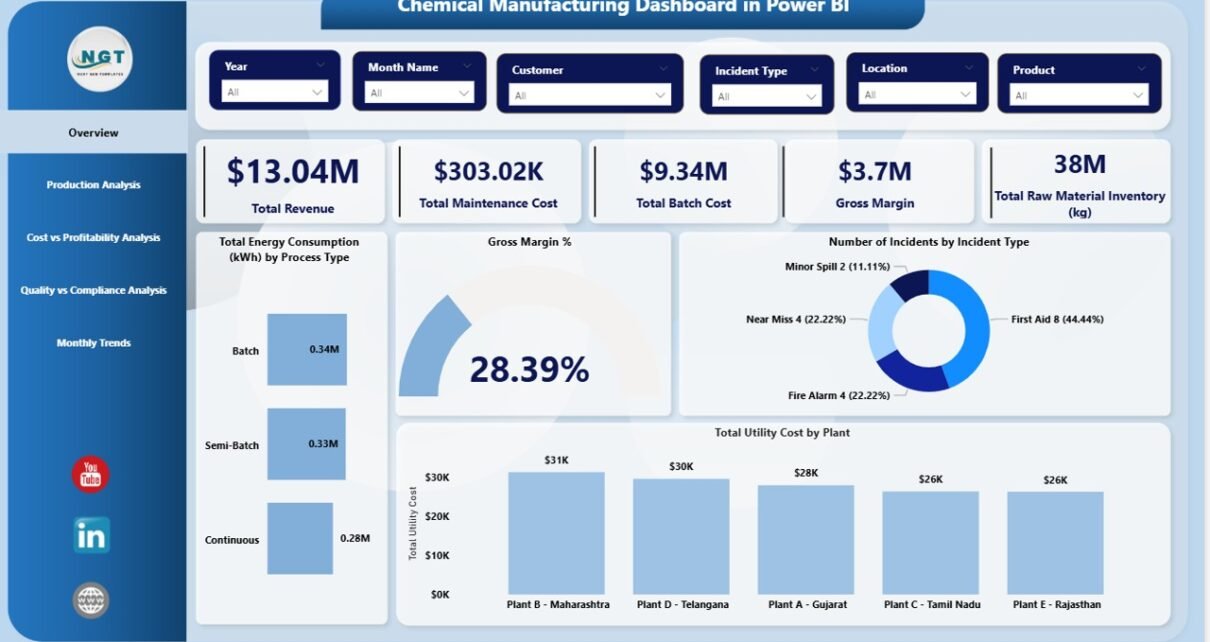
Chemical Manufacturing Dashboard in Power BI

January 21, 2026January 21, 2026 PKComments Off on Chemical Manufacturing Dashboard in Power BI
The chemical manufacturing industry operates in a highly competitive, cost-sensitive, and compliance-driven environment. Every decision depends on accurate data related to production, energy usage, quality, safety, and profitability. However, when
Read More
Dashboard

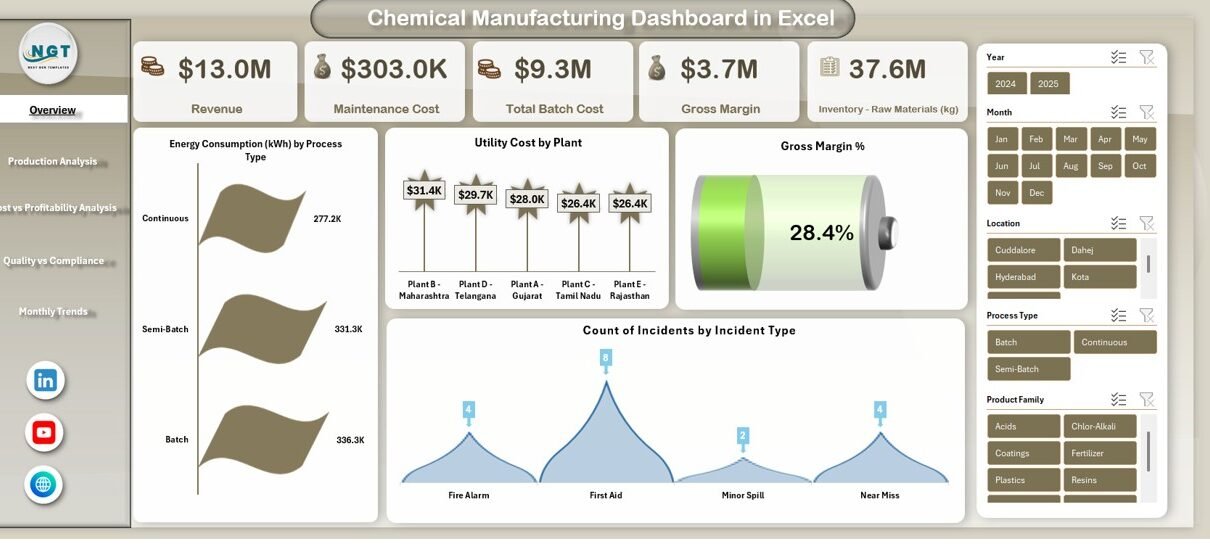
Chemical Manufacturing Dashboard in Excel

January 18, 2026January 18, 2026 PKComments Off on Chemical Manufacturing Dashboard in Excel
In today’s highly regulated and cost-sensitive chemical industry, data-driven decision-making is no longer optional. Chemical manufacturers deal with massive volumes of operational, financial, environmental, and quality data every single day.
Read More
Dashboard

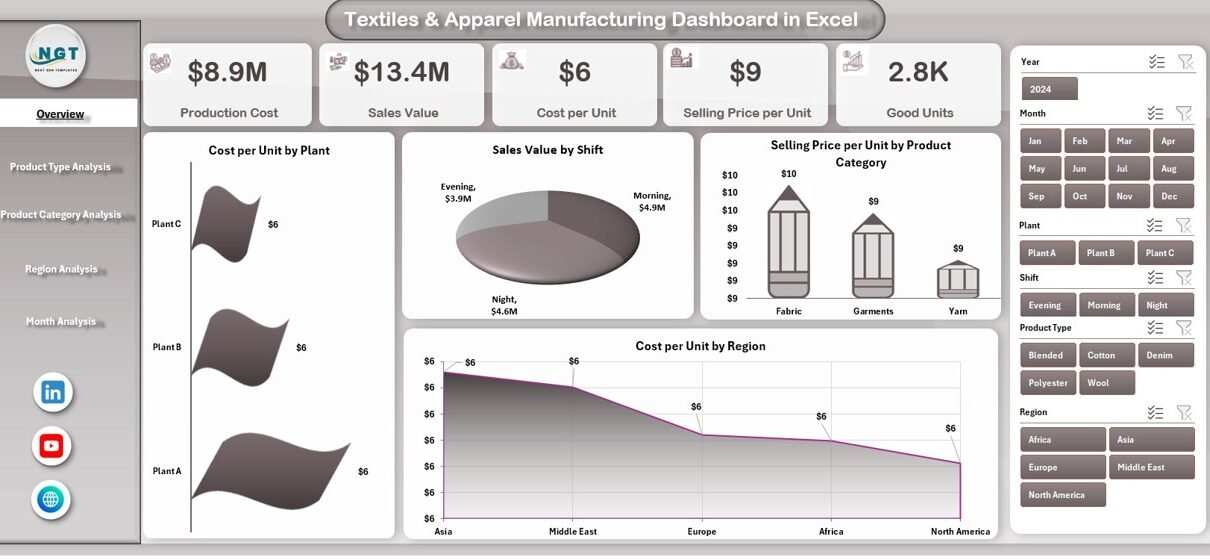
Textiles & Apparel Manufacturing Dashboard in Excel

January 16, 2026January 16, 2026 PKComments Off on Textiles & Apparel Manufacturing Dashboard in Excel
The textiles and apparel industry operates in a highly competitive, cost-sensitive, and volume-driven environment. Every day, manufacturers track production output, product cost, selling price, sales value, and regional performance. However,
Read More
Dashboard Power BI

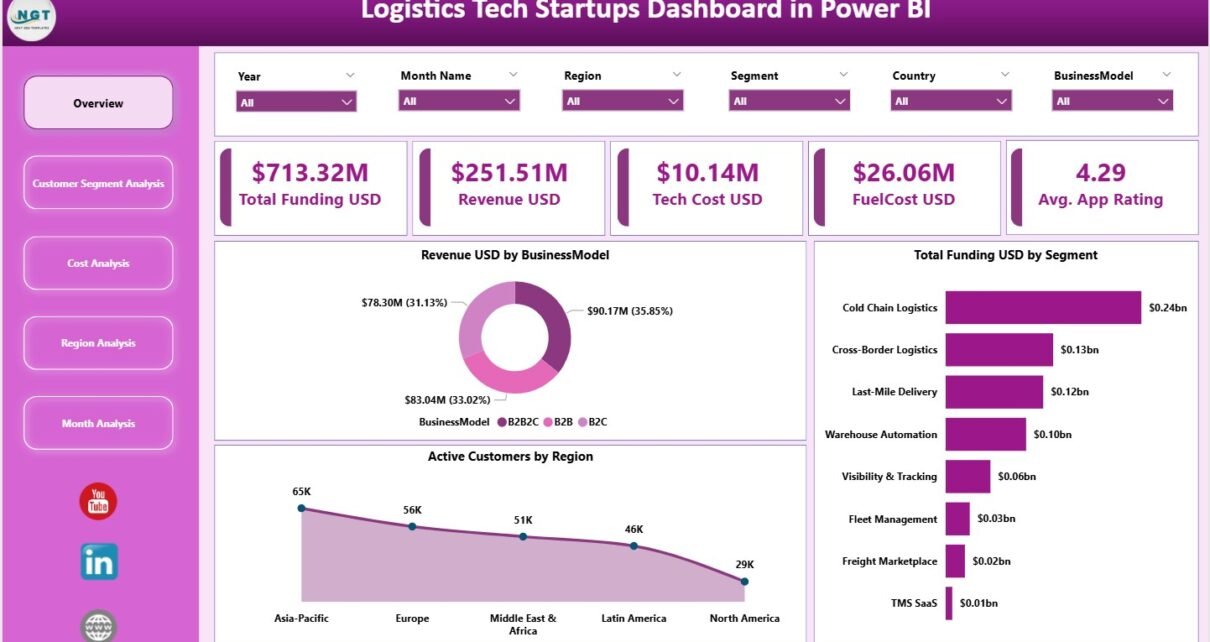
Logistics Tech Startups Dashboard in Power BI

January 7, 2026January 7, 2026 PKComments Off on Logistics Tech Startups Dashboard in Power BI
Logistics tech startups operate in a highly competitive and fast-evolving ecosystem. Funding pressure, customer expectations, rising fuel costs, and technology investments demand real-time visibility into performance. However, many startups still
Read More
Dashboard

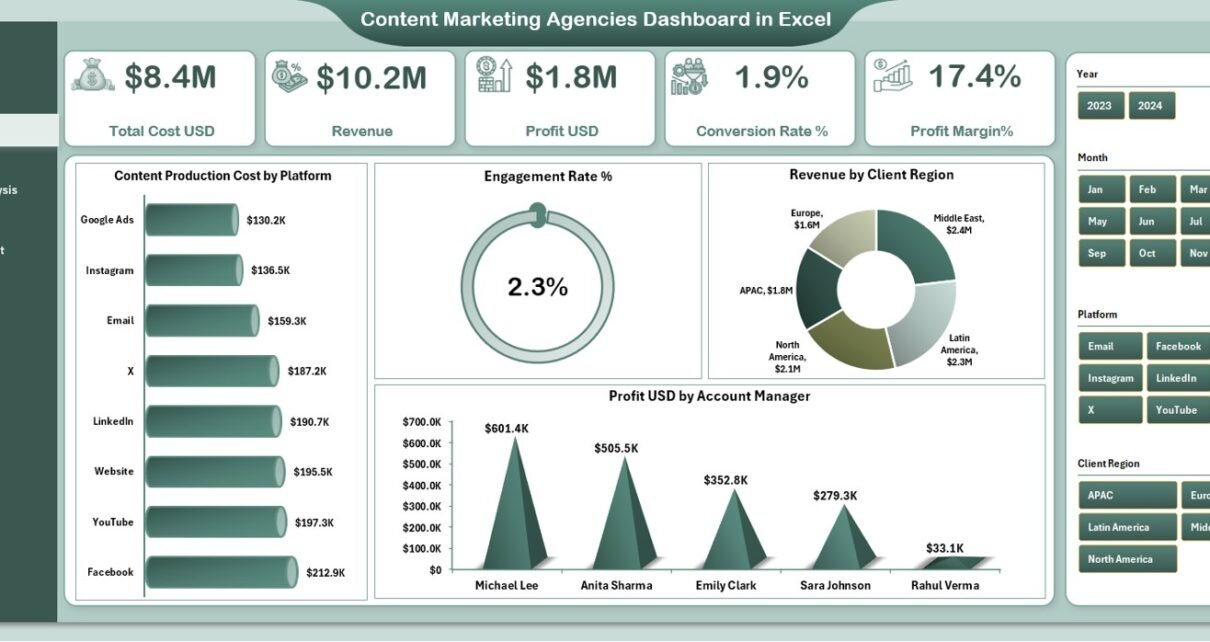
Content Marketing Agencies Dashboard in Excel

December 11, 2025December 11, 2025 PKComments Off on Content Marketing Agencies Dashboard in Excel
Content marketing agencies manage many moving parts—campaigns, platforms, clients, budgets, production costs, revenue streams, and performance metrics. Because of this complexity, agencies need a clear and structured way to track
Read More

Posts pagination

1 2 Next
  • Learn Excel (Free Course)
    • 1. Shortcut Keys
    • 2. Fill & Flash Fill
    • 3. Find & Replace
    • 4. Sort & Filter
    • 5. Formulas & Functions
    • 6. Data Validation
    • 7. Conditional Formatting
    • 8. Basic Charts
    • 9. Advanced Charts
    • 10. Pivot Tables
    • 11. Excel Dashboards
    • 12. VBA Course
    • 13. Excel Formulas with AI
  • Templates
  • Tutorials
    • Charts and Visualization
    • VBA
    • Excel Tips and Tricks
    • Excel Dashboards
    • Power Pivot & DAX
  • Power BI
  • Template Store
    • Ready to Use Templates
  • Courses
  • Academy
    • Excel + AI Mastery: 100 Formulas
    • Excel Pivot Tables & Dashboards
  • About Us
  • Contact Us
Copyright © 2023 PK-AnExcelExpert.com - Privacy Policy