New: NextGenTemplates Academy - video courses on Excel formulas with AI and Pivot Tables & dashboards. Early-bird: 20% off with code EARLYBIRD20 - first 20 orders only. See the courses →
  • Learn Excel (Free Course)
    • 1. Shortcut Keys
    • 2. Fill & Flash Fill
    • 3. Find & Replace
    • 4. Sort & Filter
    • 5. Formulas & Functions
    • 6. Data Validation
    • 7. Conditional Formatting
    • 8. Basic Charts
    • 9. Advanced Charts
    • 10. Pivot Tables
    • 11. Excel Dashboards
    • 12. VBA Course
    • 13. Excel Formulas with AI
  • Templates
  • Tutorials
    • Charts and Visualization
    • VBA
    • Excel Tips and Tricks
    • Excel Dashboards
    • Power Pivot & DAX
  • Power BI
  • Template Store
    • Ready to Use Templates
  • Courses
  • Academy
    • Excel + AI Mastery: 100 Formulas
    • Excel Pivot Tables & Dashboards
  • About Us
  • Contact Us

PK: An Excel Expert

Transforming Data into Decisions

Tag: Cost analysis

Dashboard

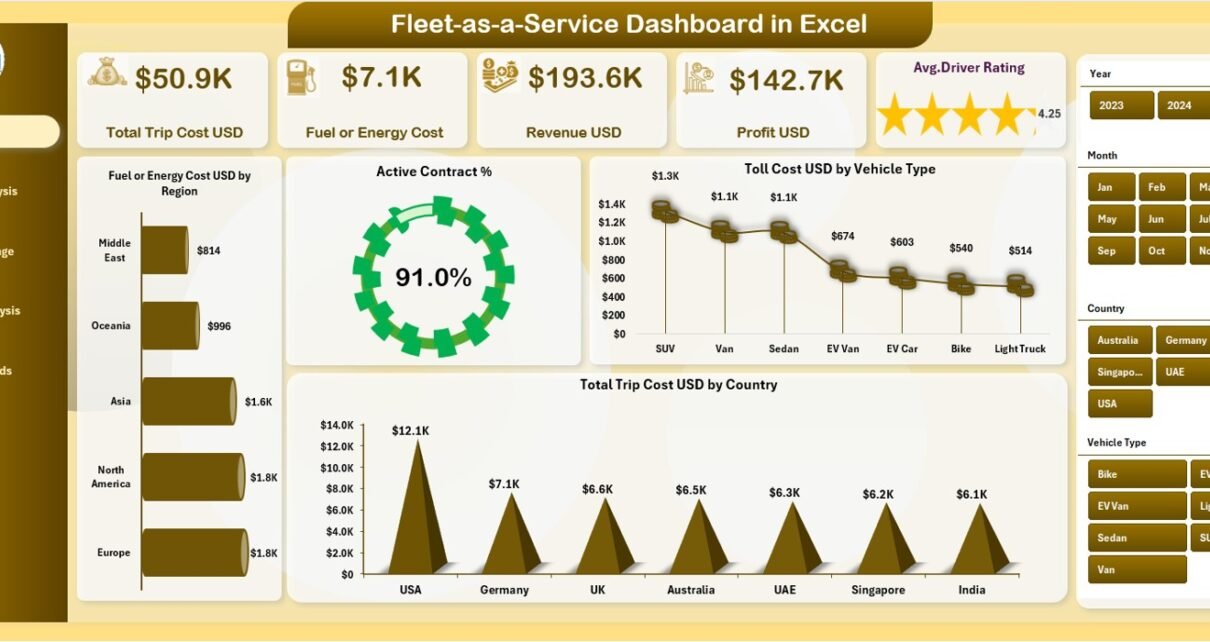
Fleet-as-a-Service Dashboard in Excel

December 8, 2025December 8, 2025 PKComments Off on Fleet-as-a-Service Dashboard in Excel
Fleet-as-a-Service (FaaS) has transformed how organizations manage transportation, mobility, and logistics. Instead of owning and maintaining large fleets, companies now focus on service-oriented fleet usage, performance, and profitability. However, without
Read More
Dashboard Power BI

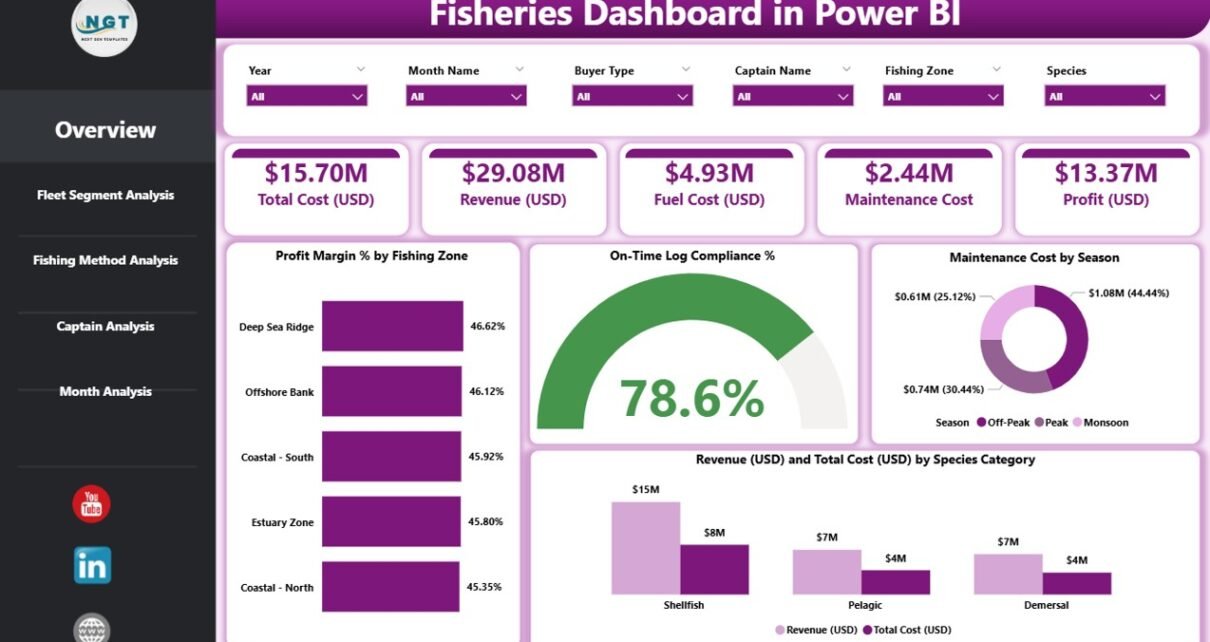
Fisheries Dashboard in Power BI

December 5, 2025December 5, 2025 PKComments Off on Fisheries Dashboard in Power BI
The fishing industry continues to grow because global demand for seafood increases every year. At the same time, fisheries face new challenges such as rising fuel prices, unpredictable marine conditions,
Read More
Dashboard

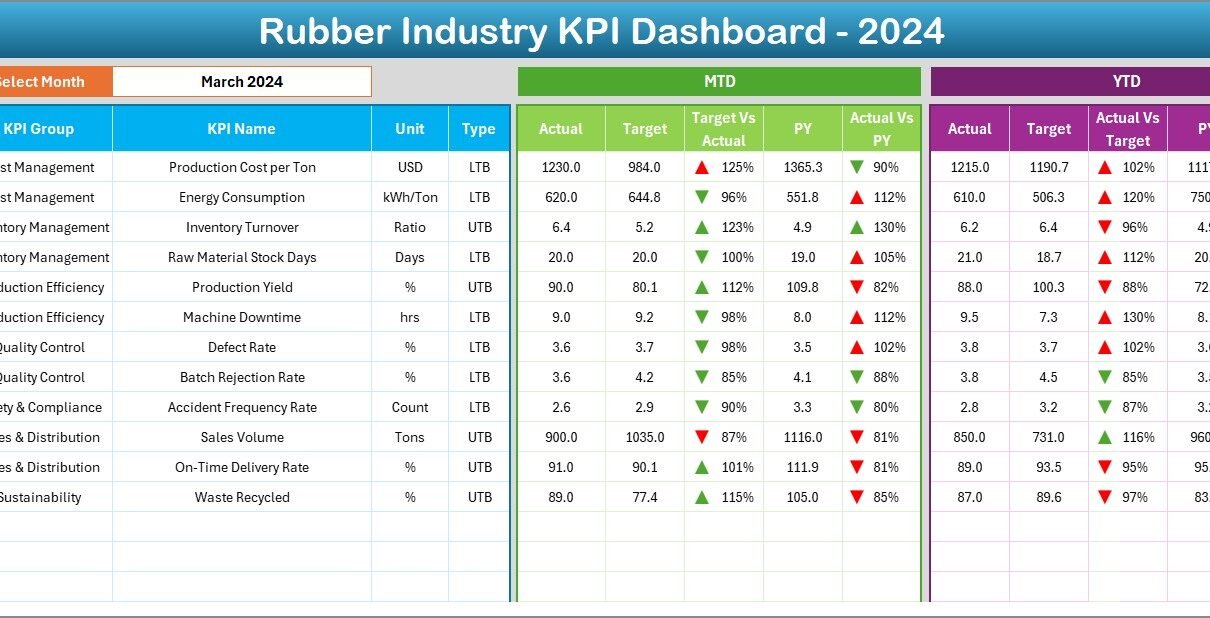
Rubber Industry KPI Dashboard in Excel

November 11, 2025November 11, 2025 PKComments Off on Rubber Industry KPI Dashboard in Excel
The rubber industry plays a critical role in manufacturing, automotive, and industrial supply chains worldwide. However, monitoring production, quality, and financial performance can become complex without a structured approach. That’s
Read More
Templates

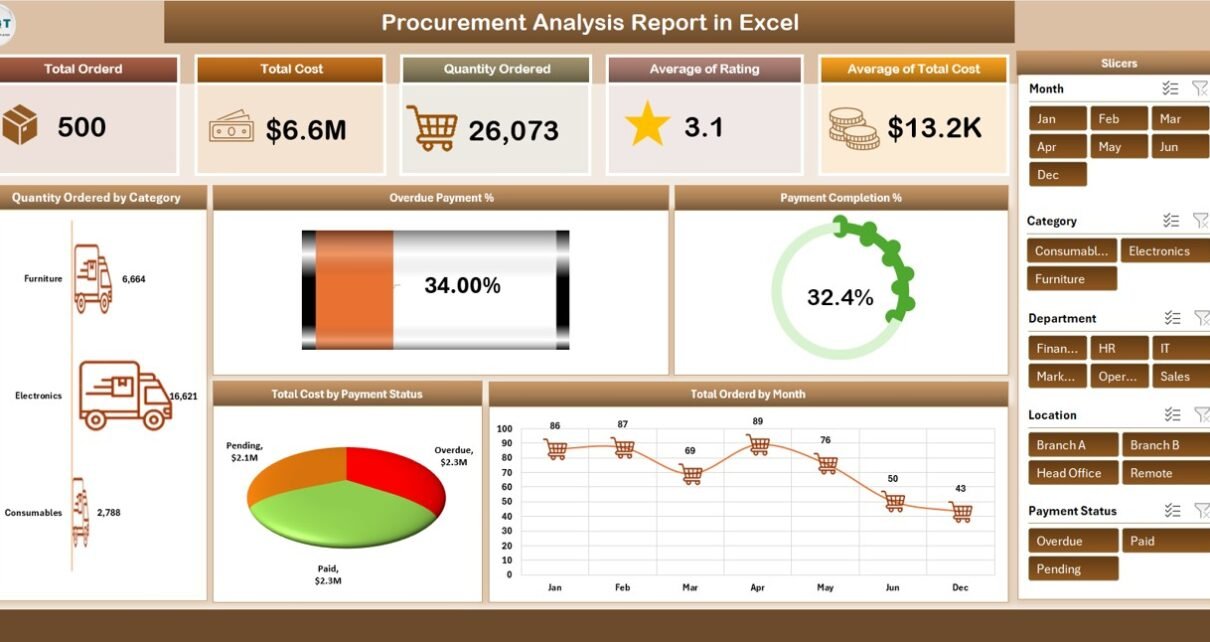
Procurement Analysis Report in Excel

September 1, 2025September 1, 2025 PKComments Off on Procurement Analysis Report in Excel
Effective procurement management is a critical component of organizational efficiency and cost control. The Procurement Analysis Report in Excel is a ready-to-use, comprehensive tool designed to help procurement professionals, finance
Read More
Dashboard

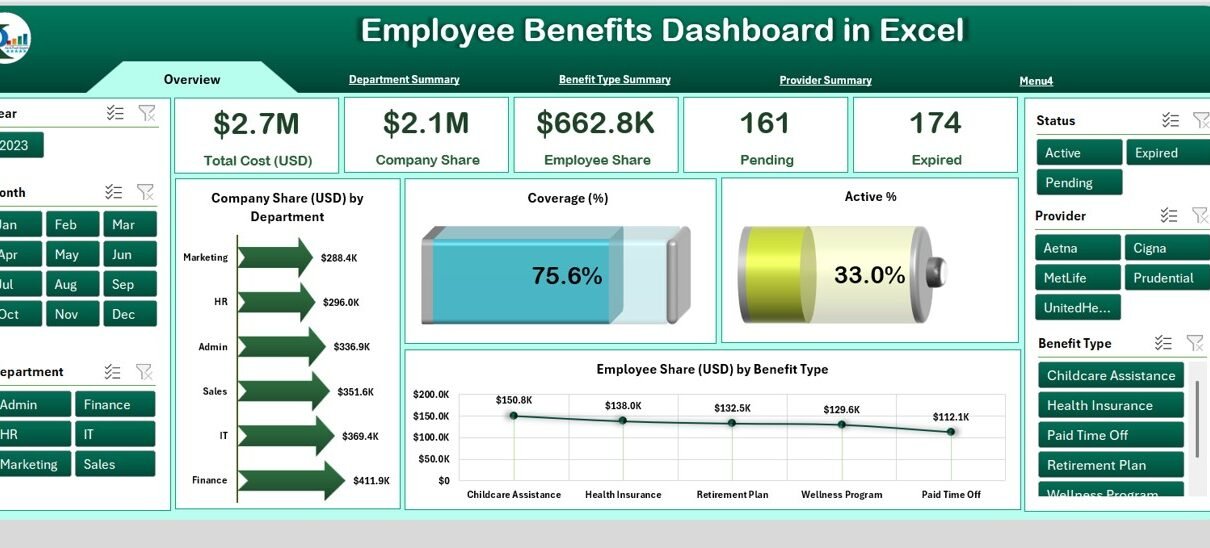
Employee Benefits Dashboard in Excel

August 5, 2025August 5, 2025 PKComments Off on Employee Benefits Dashboard in Excel
In today’s competitive job market, organizations must do more than just offer competitive salaries. They need to ensure employee satisfaction and retention by offering valuable benefits—and tracking those benefits efficiently.
Read More
Dashboard

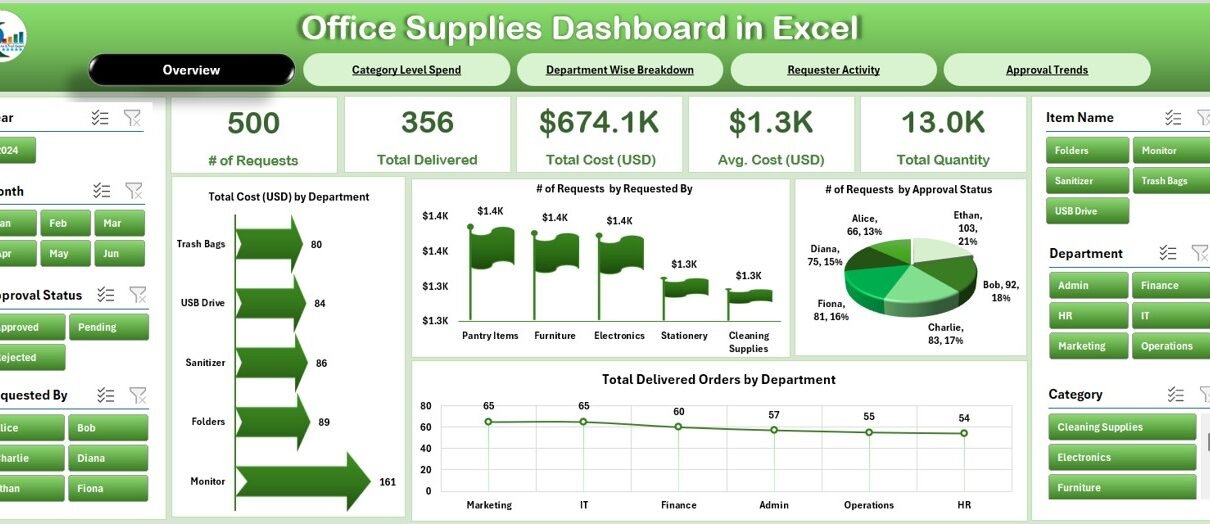
Office Supplies Dashboard in Excel

June 8, 2025June 8, 2025 PKComments Off on Office Supplies Dashboard in Excel
Managing office supplies can become overwhelming—especially when requests pile up, approvals lag, and costs increase without clear tracking. If you're tired of juggling spreadsheets and purchase records manually, it’s time
Read More
Manufacturing Dashboard in Excel
Dashboard

Manufacturing Dashboard in Excel

April 6, 2025April 6, 2025 PKComments Off on Manufacturing Dashboard in Excel
Managing manufacturing data can feel overwhelming, especially when there are multiple plants, categories, products, and supervisors to monitor. That’s where a Manufacturing Dashboard in Excel becomes your go-to solution. This
Read More
Dashboard

Procurement Dashboard in Excel

February 24, 2025 PKComments Off on Procurement Dashboard in Excel
Managing procurement is a key part of any business, but it can sometimes become overwhelming. Whether you're dealing with multiple suppliers, tracking payments, or calculating costs, keeping everything organized is
Read More
Dashboard

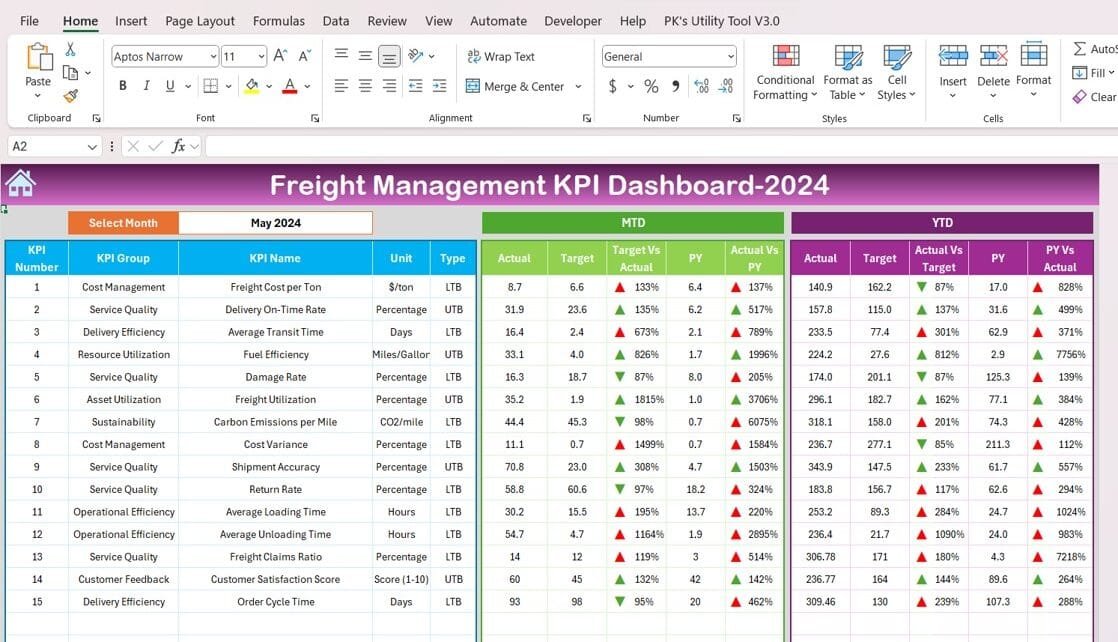
Freight Management KPI Dashboard in Excel

December 8, 2024March 4, 2025 PKComments Off on Freight Management KPI Dashboard in Excel
Effective freight management is crucial for businesses to optimize logistics and improve operational efficiency. To aid this, a Freight Management KPI Dashboard offers a structured and actionable way to monitor
Read More
Excel Forecast Formula - Predicting Best Selling Price for Maximum Profit
Predictive Analytics

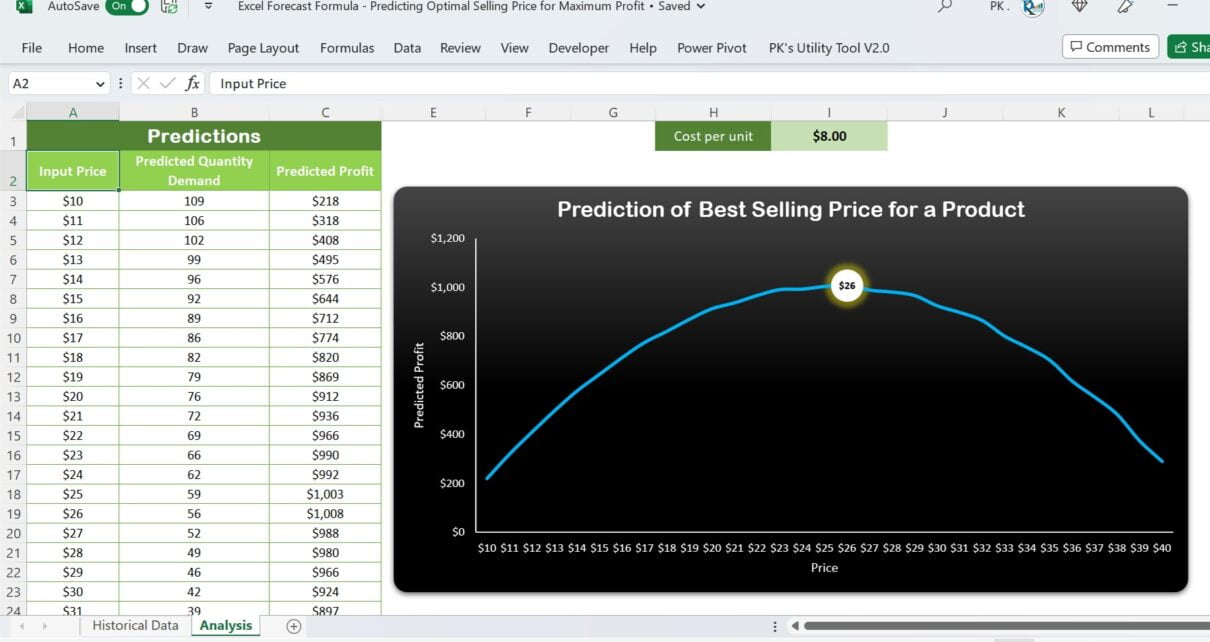
Excel Forecast Formula – Predicting Best Selling Price for Maximum Profit

February 13, 2023October 10, 2026 PKComments Off on Excel Forecast Formula – Predicting Best Selling Price for Maximum Profit
Introduction Setting the right selling price for products is a challenge to any business. It can determine whether the company succeeds or fails. To attain the highest profit margin, companies
Read More

Posts pagination

Previous 1 2
  • Learn Excel (Free Course)
    • 1. Shortcut Keys
    • 2. Fill & Flash Fill
    • 3. Find & Replace
    • 4. Sort & Filter
    • 5. Formulas & Functions
    • 6. Data Validation
    • 7. Conditional Formatting
    • 8. Basic Charts
    • 9. Advanced Charts
    • 10. Pivot Tables
    • 11. Excel Dashboards
    • 12. VBA Course
    • 13. Excel Formulas with AI
  • Templates
  • Tutorials
    • Charts and Visualization
    • VBA
    • Excel Tips and Tricks
    • Excel Dashboards
    • Power Pivot & DAX
  • Power BI
  • Template Store
    • Ready to Use Templates
  • Courses
  • Academy
    • Excel + AI Mastery: 100 Formulas
    • Excel Pivot Tables & Dashboards
  • About Us
  • Contact Us
Copyright © 2023 PK-AnExcelExpert.com - Privacy Policy