Introduction
Setting the right selling price for products is a challenge to any business. It can determine whether the company succeeds or fails. To attain the highest profit margin, companies must set the ideal selling price. However, finding the perfect selling price for maximum profit can be difficult.
Businesses must have a thorough understanding of the market, competition, and production costs to determine the optimal selling price. By considering these factors, businesses can find the pricing point that will give them an edge over their competitors and maximize their profits.
Fortunately, Excel’s forecast formula provides a solution to this issue. This formula allows businesses to analyze historical data and make informed predictions about future trends. By utilizing the forecast formula, businesses can predict how many products will be demanded at different price points. This information helps businesses to determine the optimal selling price that will yield maximum profit.
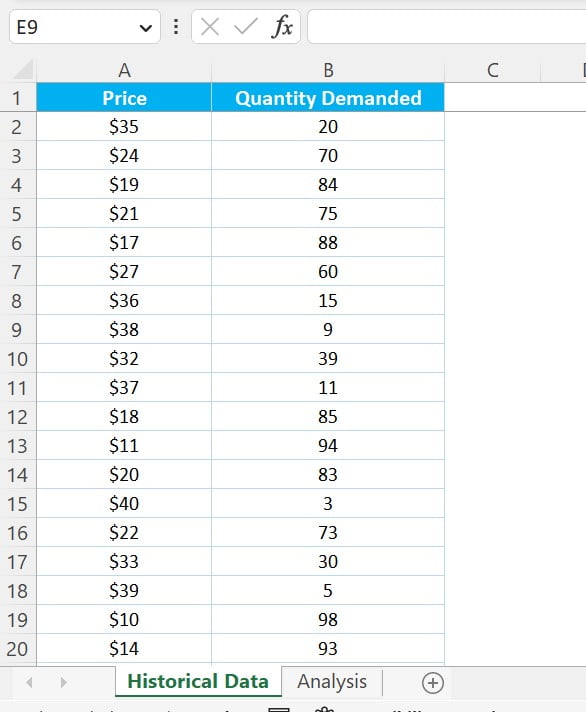
Historical Data:
In the historical data we have Price per unit and Quantity demanded for multiple instances. Using this data, we will use the forecast method to get the best-selling price of a Product. We have created a separate sheet for Historical Data.
Setting up the Analysis Worksheet
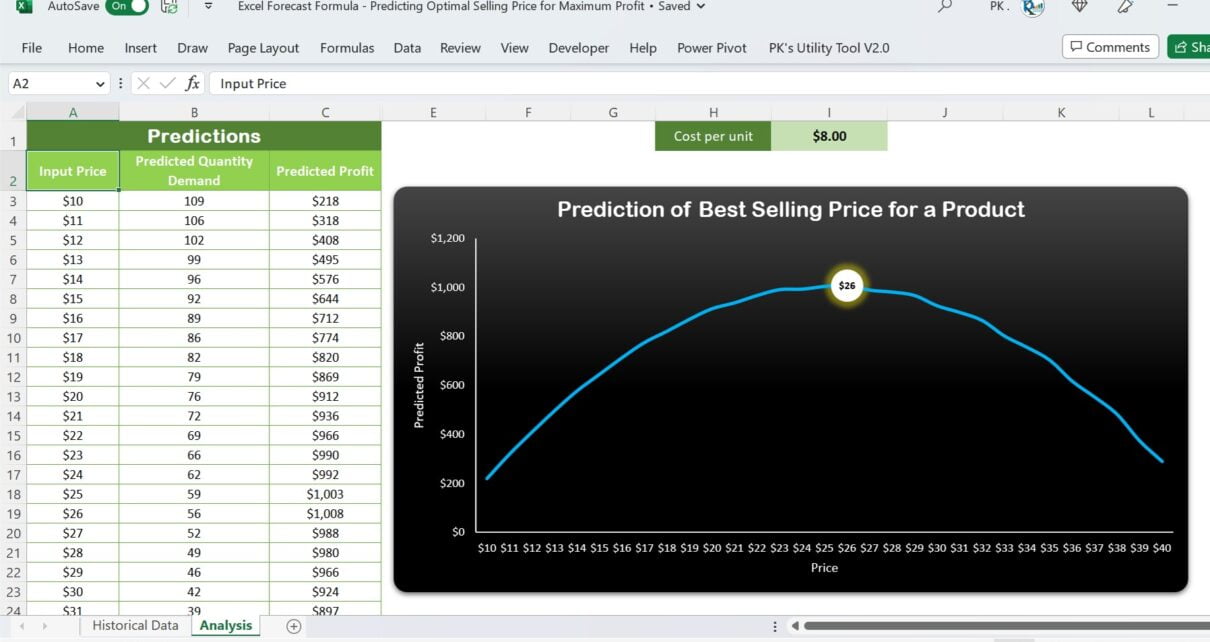
To begin with, we need to set up an Analysis worksheet. This worksheet will have four columns: Input Price, Predicted Quantity Demand, Predicted Profit, and Predicted Profit for Best Price. We also need historical data on Price wise Quantity Demanded on the Historical Data worksheet. We will create a dynamic range for all the ranges using the OFFSET formula.
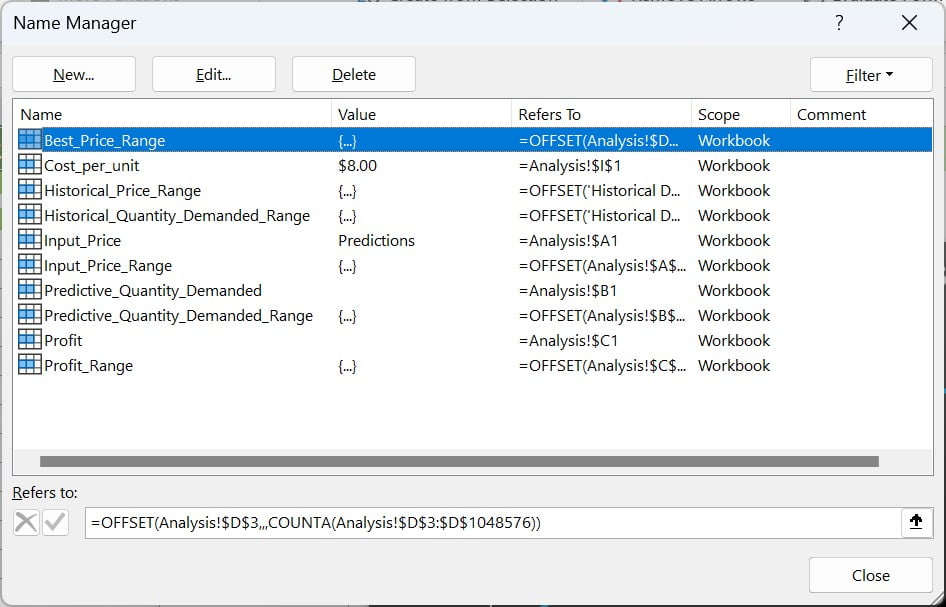
The dynamic ranges that we will create are as follows:
Historical_Price_Range:
“=OFFSET('Historical Data'!$A$2,,,COUNTA('Historical Data'!$A$2:$A$1048576))”
Historical_Quantity_Demanded_Range:
“=OFFSET('Historical Data'!$B$2,,,COUNTA('Historical Data'!$B$2:$B$1048576))”
Input_Price_Range:
“=OFFSET(Analysis!$A$3,,,COUNTA(Analysis!$A$3:$A$1048576))”
Predictive_Quantity_Demanded_Range:
“=OFFSET(Analysis!$B$3,,,COUNTA(Analysis!$B$3:$B$1048576))”
Profit_Range:
“=OFFSET(Analysis!$C$3,,,COUNTA(Analysis!$C$3:$C$1048576))”
Best_Price_Range:
“=OFFSET(Analysis!$D$3,,,COUNTA(Analysis!$D$3:$D$1048576))”
Cost_Per_Unit:
“=Analysis!$I$1”
Using the Forecast Formula for Predicting Quantity Demand
The subsequent step necessitates using the FORECAST formula to prognosticate the quantity demand for a certain price. We shall specify an Input Price range ranging from $10 to $40 and utilize the FORECAST formula to predict the quantity demand for each of the prices within the range. The formula used to forecast the quantity demand is:
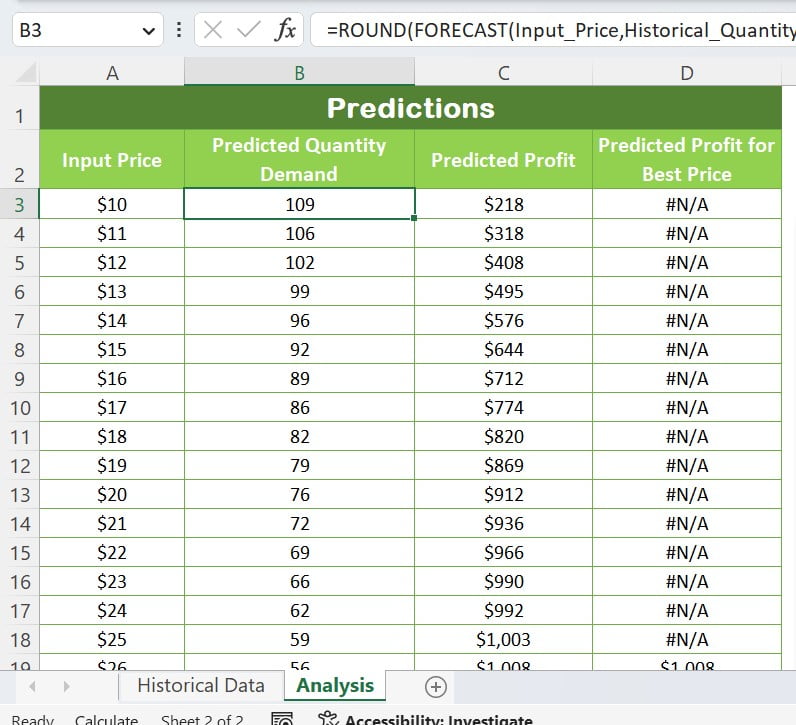
=ROUND(FORECAST(Input_Price,Historical_Quantity_Demanded_Range,Historical_Price_Range),0)
Upon doing so, we shall round off the predicted quantity demand to the nearest whole number.
Calculating Predicted Profit
To embark on the process of determining the optimal selling price, we must first delve into the calculation of predicted profit. This involves a formula that entails the multiplication of the Input_Price and Predictive_Quantity_Demanded. In addition, we must subtract the product of Cost_Per_Unit and Predictive_Quantity_Demanded, which would be extracted from the Cost_Per_Unit dynamic range.
To determine the price that would generate the highest profit, we need to deploy a formula that would help us find the predicted profit for the best price. We will use below function to get the Predicted Profit
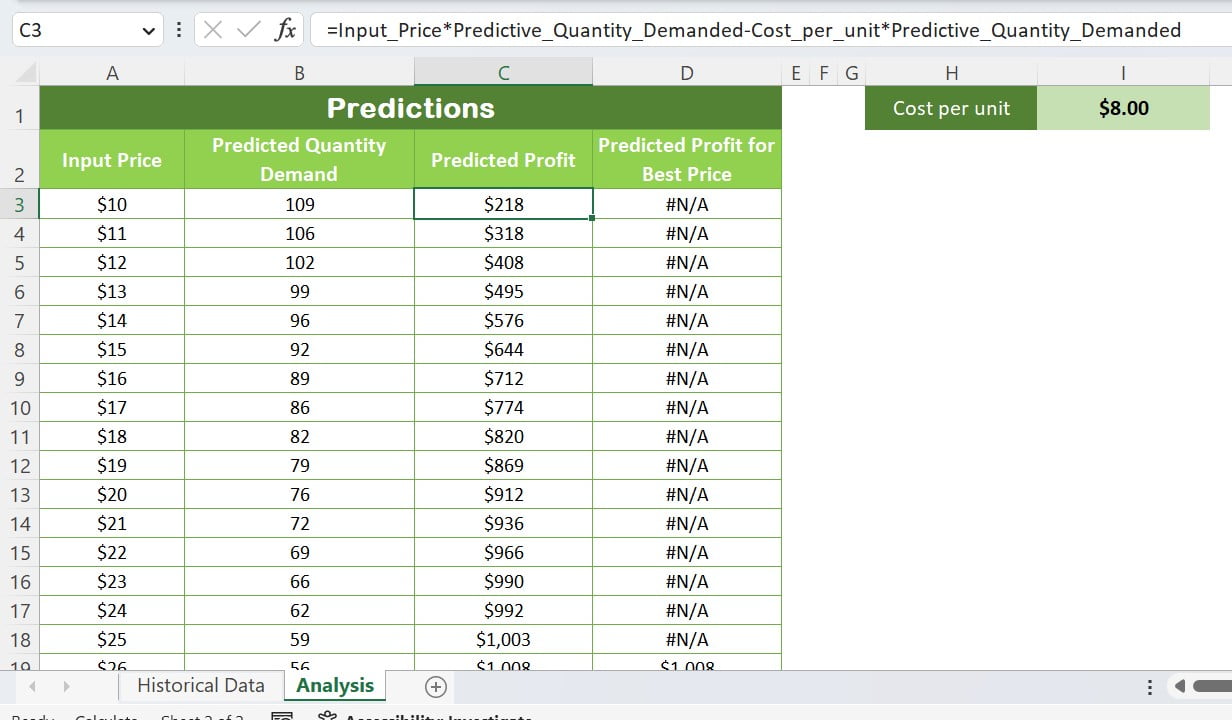
=Input_PricePredictive_Quantity_Demanded-Cost_per_unitPredictive_Quantity_Demanded
Determining the Best-Selling Price for Maximum Profit
To determine the optimal price for maximum profit, we will use the formula:
=IF(MAX(Profit_Range)=Profit,Profit,NA())
This formula will return the maximum profit from the Profit Range and in the other cells it will return #N/A error. We will use this show the maximum profit marker on the line chart. In this marker we will show the Best-Selling Price.
Creating a Line Chart
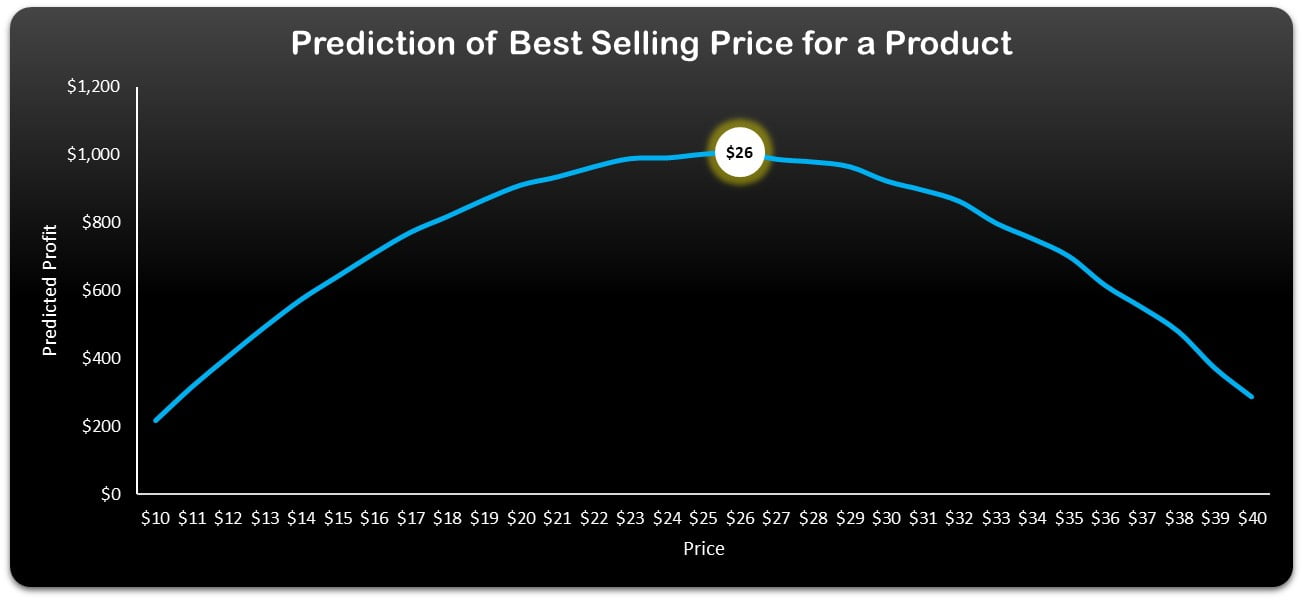
To visualize the relationship between the input price and predicted profit, we can create a line chart. We will use the Input Price range on the horizontal axis and the Predicted Profit range on the vertical axis.
In conclusion, predicting the optimal selling price for maximum profit is a crucial aspect of business decision making. With the help of Excel’s Forecast formula, we can accurately predict the quantity demand of a product at different prices. This information can then be used to calculate the predicted profit for each price point and determine the optimal price for maximum profit.
By setting up the Analysis worksheet and defining the dynamic ranges using the OFFSET formula, we can easily perform these calculations and create a line chart to visualize the relationship between price and profit. Identifying the optimal price on the line chart using a small circle can help businesses make informed decisions that maximize their profits.
Overall, the Excel Forecast formula is a powerful tool that can help businesses make data-driven decisions and stay ahead of the competition. By taking advantage of this formula and following the steps outlined in this article, businesses can increase their chances of success and achieve their financial goals.