In this article, we have explained how to predict a value using multiple regression Analysis in Microsoft Excel.
What is Multiple Regression?
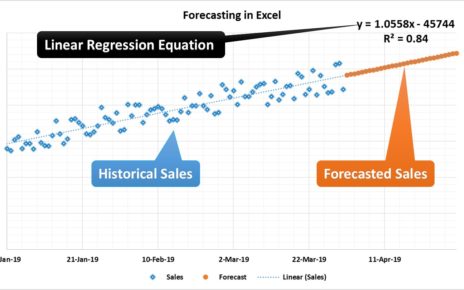
Multiple regression is an extension of simple linear regression. It is used when we want to predict the value of a variable based on the value of two or more other variables. The variable we want to predict is called the dependent variable (or sometimes, the outcome, target or criterion variable)
Profit Optimizer in Excel using Multiple Regression
The multiple regression equation is y = b1x1 + b2x2 + … + bnxn + c. Here, bi’s (i=1,2…n) are the regression coefficients, which represent the value at which the criterion variable changes when the predictor variable changes.
You can use the Data Analysis Add-in to run a regression in Excel. if the Data Analysis command is not available in your version of Excel, you need to load the Analysis ToolPak add-in program. These instructions apply to Excel 2010, Excel 2013 and Excel 2016.
- Click the File tab, click Options, and then click the Add-Ins category.
- In the Manage box, select Excel Add-ins and then click Go.
- In the Add-Ins available box, select the Analysis ToolPak check box, and then click OK.
- Data Analysis button will be available in Data tab.
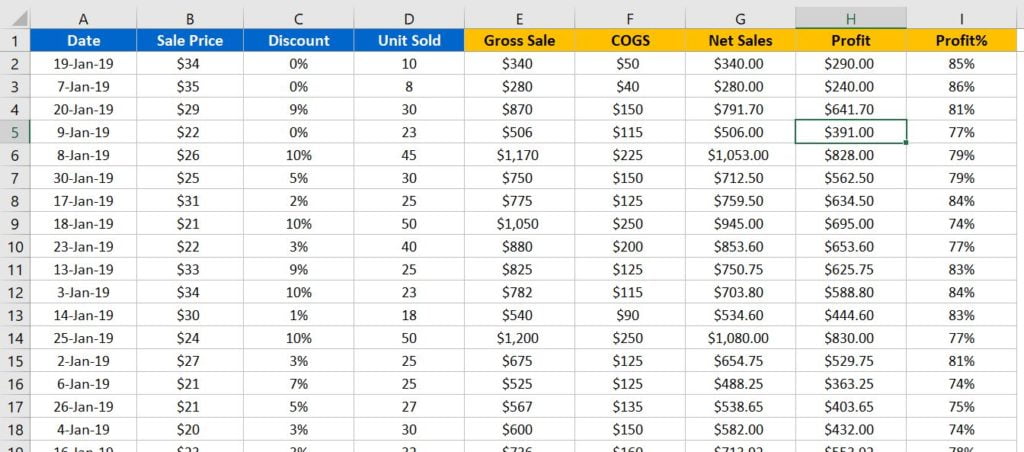
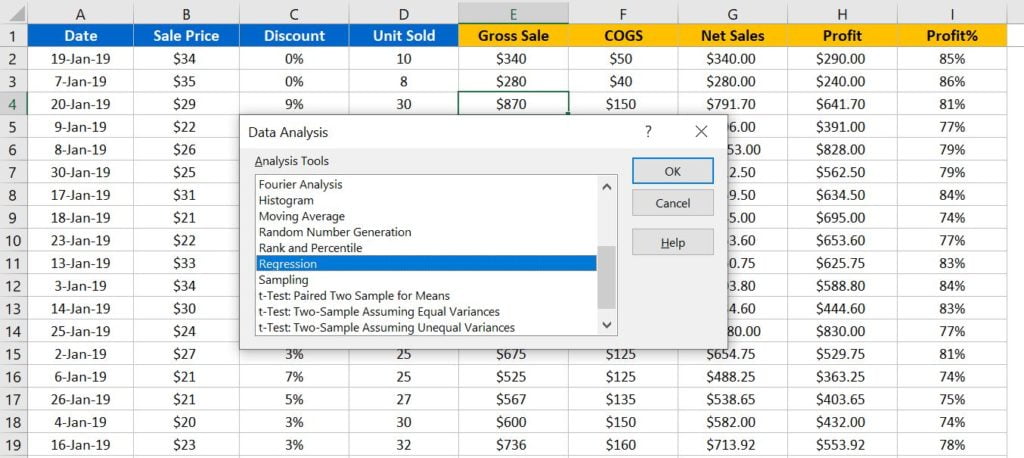
We have the below given Sales data. We have to create a model on to predict the Unit sold on the base of Sale Price and Discount%.
Below is the steps to run the regression in Excel.
Click to buy Profit Optimizer in Excel using Multiple Regression
- Click on Data Analysis button in Data Tab
- Data Analysis window will be opened.
- Select the Regression in this window and click on OK
Click to buy Profit Optimizer in Excel using Multiple Regression
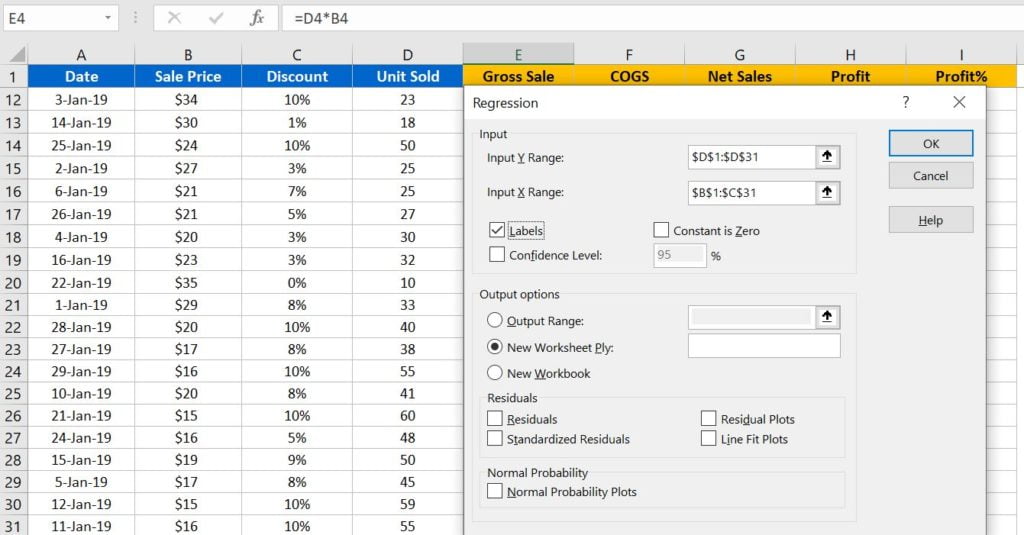
- Provide the Input Y Range for until sold (Select the data including headers)
- Provide the Input X Range for Sale Price and Discount% (Select the data including headers)
- Tick the Labels check box.
- Click on OK.https://www.pk-anexcelexpert.com/?post_type=download&p=63809&preview=truehttps://www.pk-anexcelexpert.com/?post_type=download&p=63809&preview=true
Click to buy Profit Optimizer in Excel using Multiple Regression
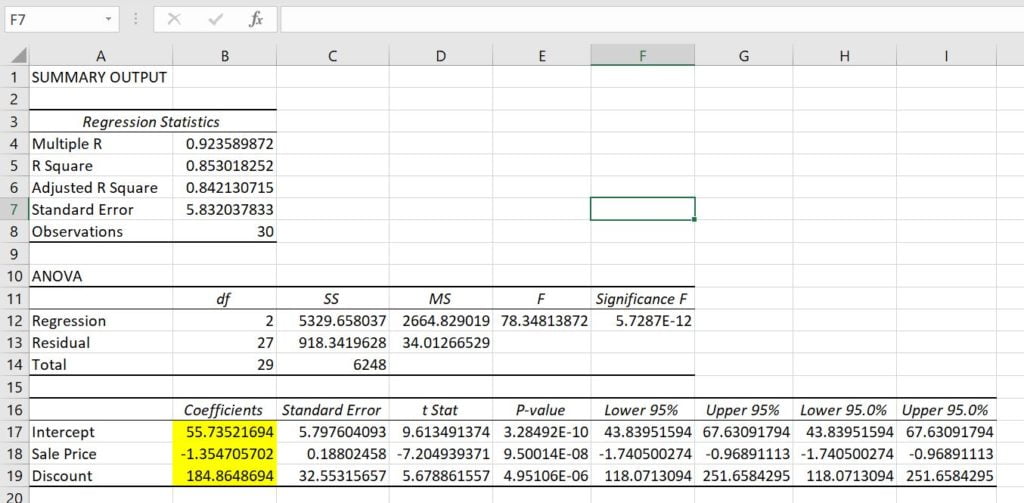
Regression Summary Output sheet will be created. We will use Intercept and Coefficients values to calculate the predicted Until Sale on the base Discount% and Sale Price. These values are highlighted in yellow in below given image.
Click to buy Profit Optimizer in Excel using Multiple Regression
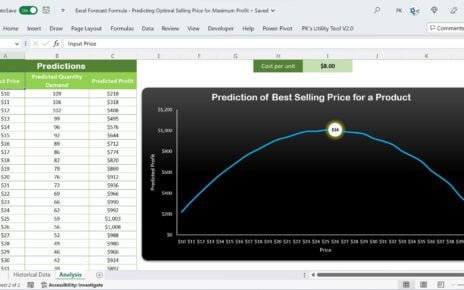
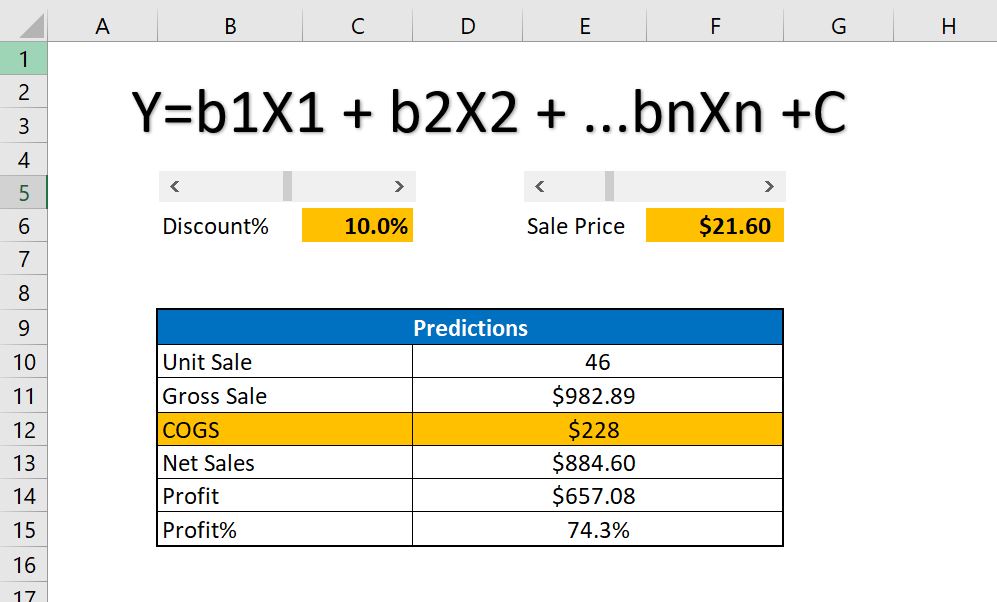
Now we can create a table as given in below image and we can put below given formula to predict the Unit Sale –
Predicted Unit Sale = Sale Price * Sale Price Coefficient + Discount% * Discount% Coefficient + Intercept
Once we will get Predicted Unit Sale then we can get the other values also –
Gross Sale = Predicted Unit Sale * Given Sale Price Net Sale = Gross Sale – Gross Sale * Given Discount% COGS (Cost of Goods) = Predicted Unit Sale * 5 (Note here you can take your own COGS Calculation, We have put a default cost per unit 5) Profit = Net Sale – COGS Profit% = Profit / Net Sale
Profit Optimizer in Excel using Multiple Regression
Click to buy Profit Optimizer in Excel using Multiple Regression
Watch the step by step video tutorial-
vhttps://www.pk-anexcelexpert.com/wp-content/uploads/2023/02/Excel-Forecast-Formula-Predicting-Optimal-Selling-Price-for-Maximum-Profit.xlsx
Visit our YouTube channel to learn step-by-step video tutorials
Click to buy Profit Optimizer in Excel using Multiple Regression