In this article, we have explained how to calculate the Correlation Coefficient in Microsoft Excel. We have explained it using Excel Formula and Data Analysis Add-in.
What is Correlation Coefficient?
A correlation coefficient is a numerical measure of some type of correlation, meaning a statistical relationship between two variables. Correlation can be between -1 to +1.Correlation Coefficient in minus is called negative correlation and in plus called positive correlation. If correlation value is close to ±1 then it is called strong correlation if it is close to zero then it is called poor correlation.
How to Correlation Coefficient using Excel formulas?
We can use “CORREL” Or “PEARSON” Excel formula to calculate the correlation between to variables.
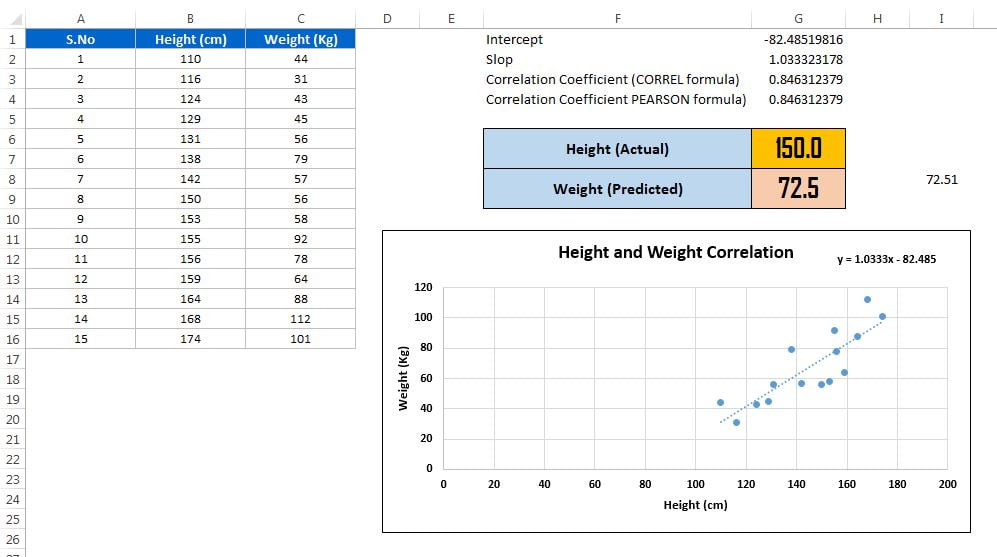
For example, we have height and weight data points as given in below image –
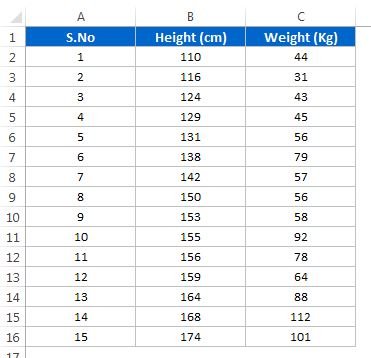
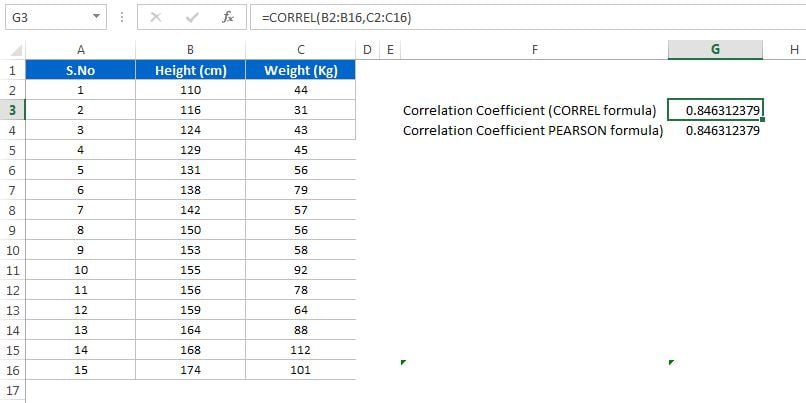
Below is the formula to calculate the correlation-
=CORREL(B2:B16,C2:C16)
or
=PEARSON(B2:B16,C2:C16)
You can use the Data Analysis Add-in also. It can help you calculate the multiple variables correlation with each other.
if the Data Analysis command is not available in your version of Excel, you need to load the Analysis ToolPak add-in program. These instructions apply to Excel 2010, Excel 2013 and Excel 2016.
- Click the File tab, click Options, and then click the Add-Ins category.
- In the Manage box, select Excel Add-ins and then click Go.
- In the Add-Ins available box, select the Analysis ToolPak check box, and then click OK.
- Data Analysis button will be available in Data tab.
Below is the steps to get the multiple variables correlation with each other.
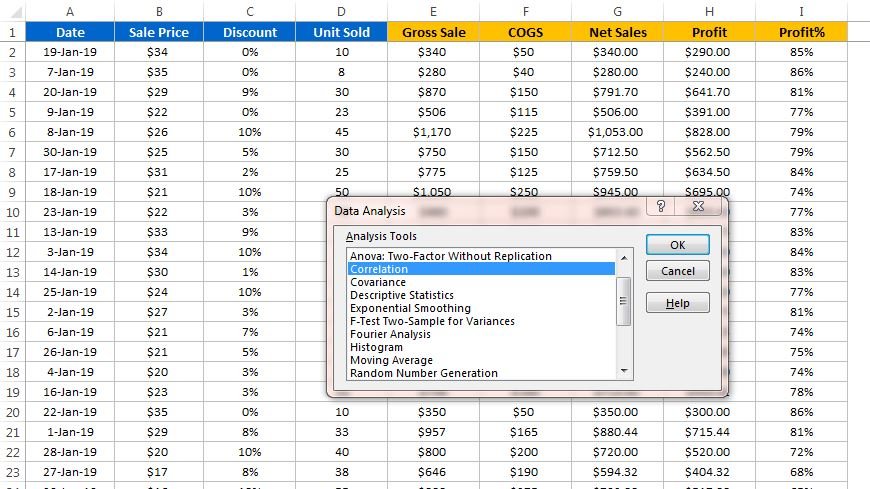
- Click on Data Analysis button in Data Tab
- Data Analysis window will be opened.
- Select the Correlation in this window and click on OK
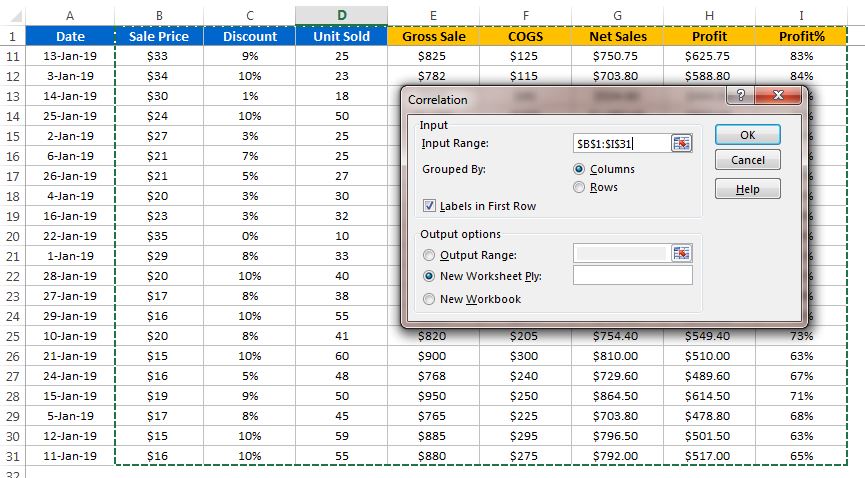
- Provide the input range in Correlation window (Select the data including headers)
- Tick the Label in first row check box
- Click on OK.
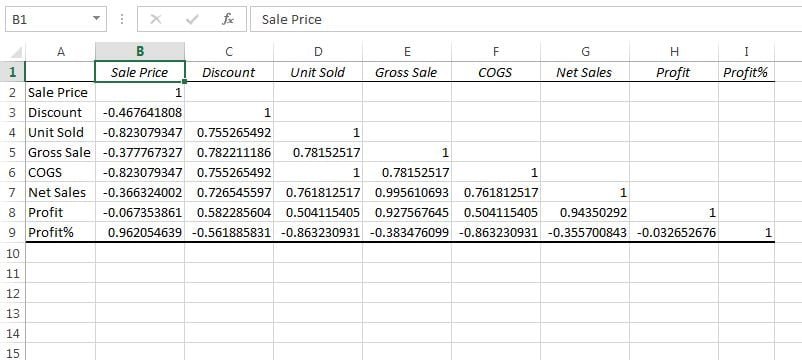
- Correlation summary will be created on new worksheet.
Click here to download this practice file.
Watch the step by step video tutorial:
Visit our YouTube channel to learn step-by-step video tutorials