New: NextGenTemplates Academy - video courses on Excel formulas with AI and Pivot Tables & dashboards. Early-bird: 20% off with code EARLYBIRD20 - first 20 orders only. See the courses →
  • Learn Excel (Free Course)
    • 1. Shortcut Keys
    • 2. Fill & Flash Fill
    • 3. Find & Replace
    • 4. Sort & Filter
    • 5. Formulas & Functions
    • 6. Data Validation
    • 7. Conditional Formatting
    • 8. Basic Charts
    • 9. Advanced Charts
    • 10. Pivot Tables
    • 11. Excel Dashboards
    • 12. VBA Course
    • 13. Excel Formulas with AI
  • Templates
  • Tutorials
    • Charts and Visualization
    • VBA
    • Excel Tips and Tricks
    • Excel Dashboards
    • Power Pivot & DAX
  • Power BI
  • Template Store
    • Ready to Use Templates
  • Courses
  • Academy
    • Excel + AI Mastery: 100 Formulas
    • Excel Pivot Tables & Dashboards
  • About Us
  • Contact Us

PK: An Excel Expert

Transforming Data into Decisions

Tag: CX Dashboard

Dashboard Power BI

CX Journey Mapping Dashboard in Power BI

August 31, 2026August 31, 2026 PKComments Off on CX Journey Mapping Dashboard in Power BI
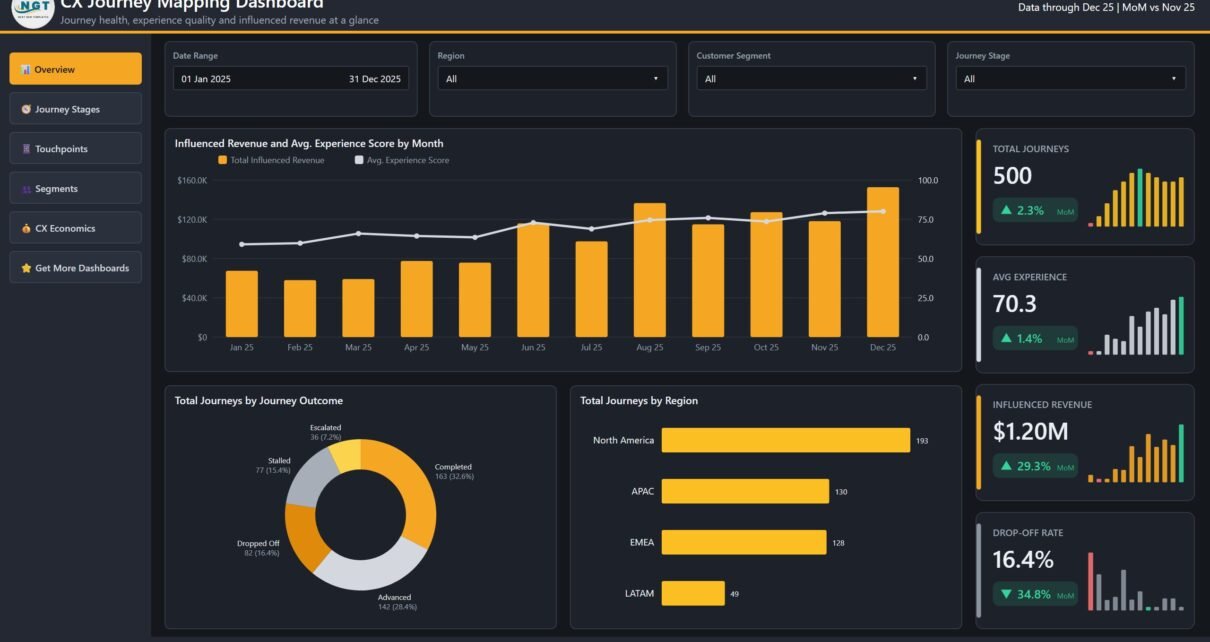
Most customer-experience reporting stops at a satisfaction score. The CX Journey Mapping Dashboard in Power BI goes further: it takes 500 sample customer journeys and shows where they stall, which
Read More
Dashboard Templates

CX Journey Mapping Dashboard in Excel

August 29, 2026August 29, 2026 PKComments Off on CX Journey Mapping Dashboard in Excel
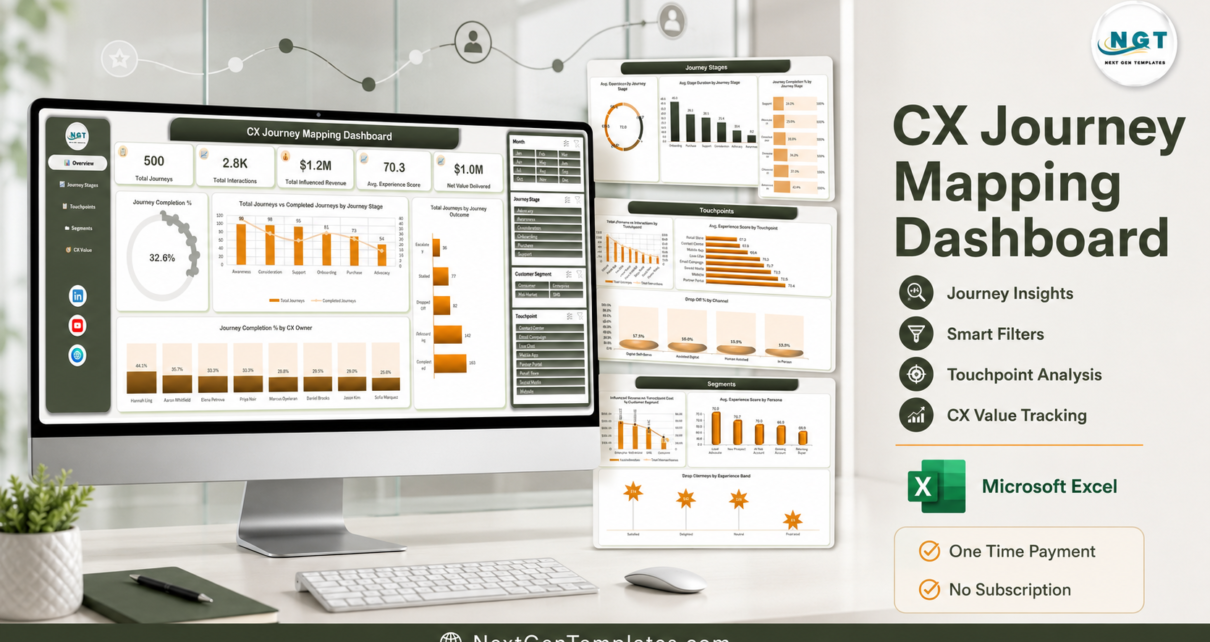
The CX Journey Mapping Dashboard in Excel analyses 500 customer journeys across 6 journey stages, 8 touchpoints and 4 service channels. It ships as a 7-sheet workbook: 5 interactive dashboard
Read More
Dashboard Power BI

Customer Experience (CX) KPI Dashboard in Power BI

November 29, 2025November 29, 2025 PKComments Off on Customer Experience (CX) KPI Dashboard in Power BI
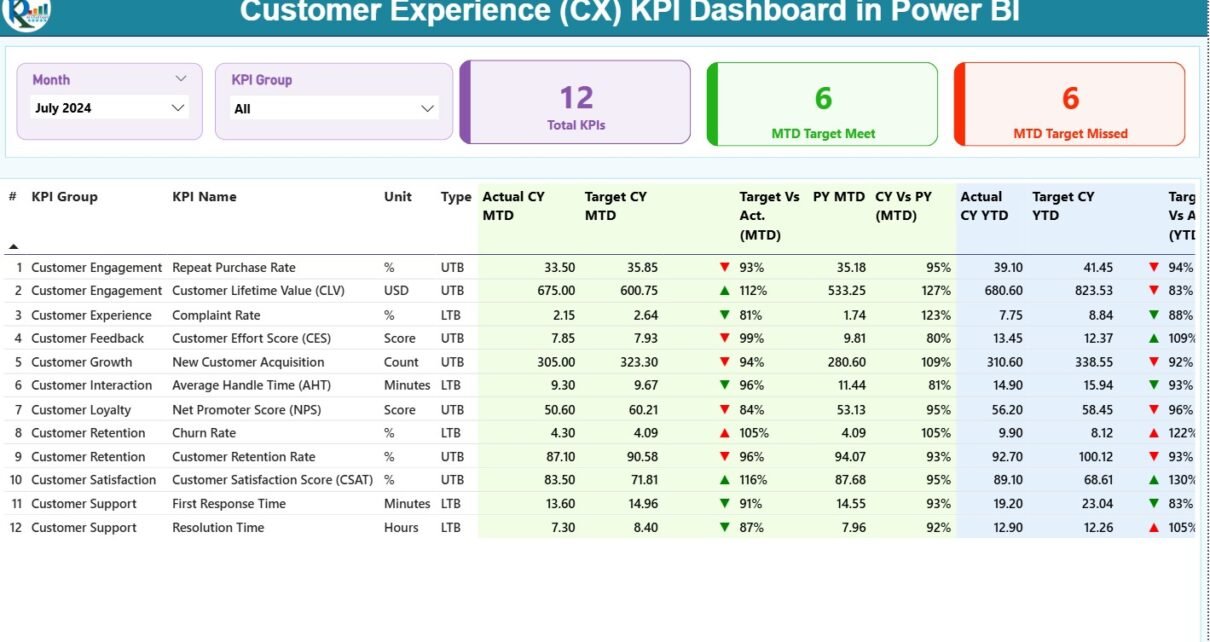
Customer Experience (CX) plays an important role in every business. When customers feel valued, they stay longer, spend more, and recommend your brand to others. Because of this, companies now
Read More
Dashboard

Customer Experience (CX) KPI Dashboard in Excel

November 7, 2025November 7, 2025 PKComments Off on Customer Experience (CX) KPI Dashboard in Excel
In today’s experience-driven world, customer satisfaction defines business success. Every interaction — from first contact to post-purchase support — shapes how customers perceive your brand. Companies that measure and manage
Read More
  • Learn Excel (Free Course)
    • 1. Shortcut Keys
    • 2. Fill & Flash Fill
    • 3. Find & Replace
    • 4. Sort & Filter
    • 5. Formulas & Functions
    • 6. Data Validation
    • 7. Conditional Formatting
    • 8. Basic Charts
    • 9. Advanced Charts
    • 10. Pivot Tables
    • 11. Excel Dashboards
    • 12. VBA Course
    • 13. Excel Formulas with AI
  • Templates
  • Tutorials
    • Charts and Visualization
    • VBA
    • Excel Tips and Tricks
    • Excel Dashboards
    • Power Pivot & DAX
  • Power BI
  • Template Store
    • Ready to Use Templates
  • Courses
  • Academy
    • Excel + AI Mastery: 100 Formulas
    • Excel Pivot Tables & Dashboards
  • About Us
  • Contact Us
Copyright © 2023 PK-AnExcelExpert.com - Privacy Policy