New: NextGenTemplates Academy - video courses on Excel formulas with AI and Pivot Tables & dashboards. Early-bird: 20% off with code EARLYBIRD20 - first 20 orders only.See the courses →
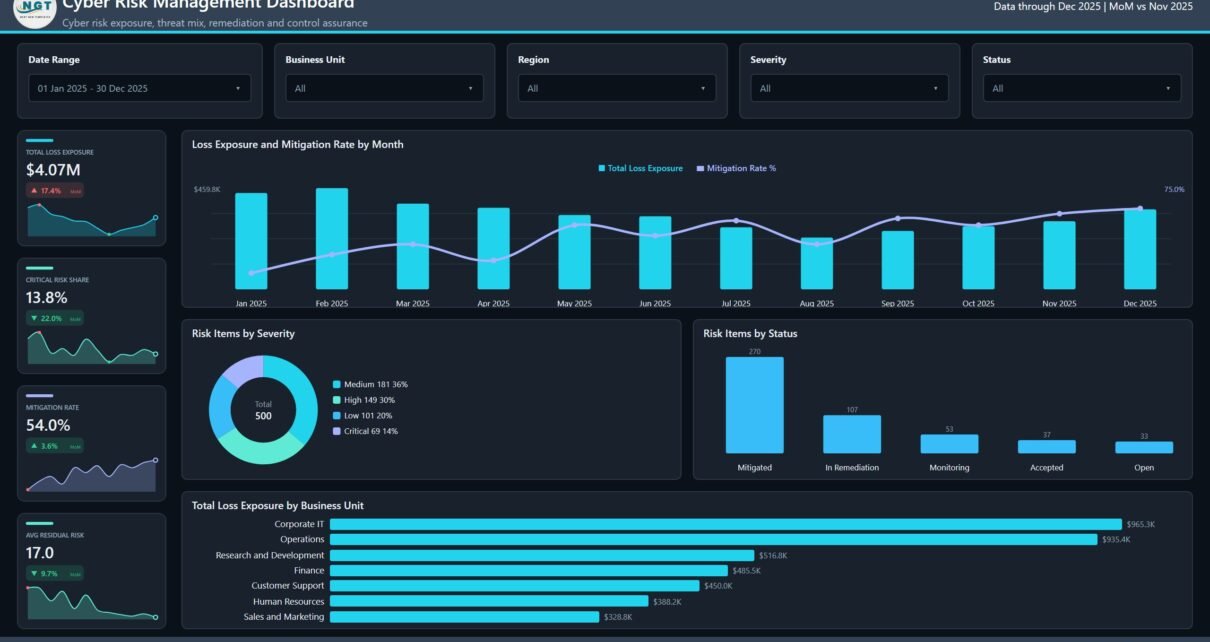
PKComments Off on Cyber Risk Management Dashboard in Power BI
Most cyber risk registers die in a spreadsheet. The rows go in, the severities get typed, and once a quarter somebody pastes a few screenshots into a slide deck. The
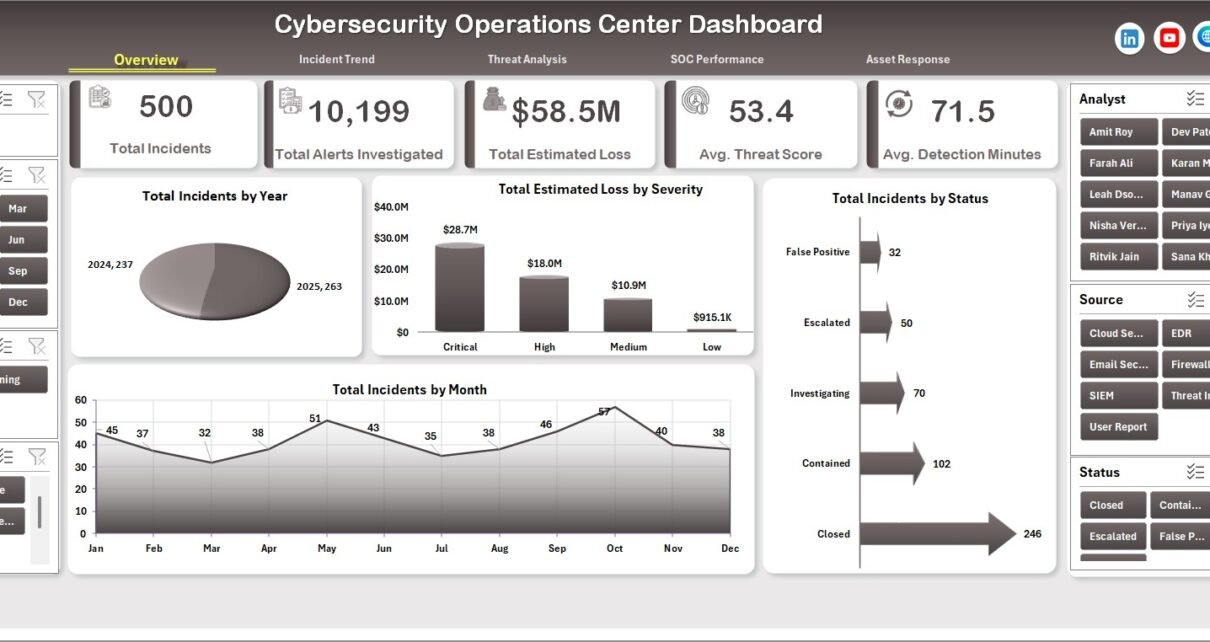
PKComments Off on Cybersecurity Operations Center Dashboard in Power BI
The average Cybersecurity Operations Center Dashboard in Power BI users build by hand takes 40-60 hours of DAX work and another 8-12 hours of layout polish. This ready-to-deploy template ships
PKComments Off on Cybersecurity Operations Center Dashboard in Excel
Cybersecurity Operations Center Dashboard in Excel helps SOC teams turn scattered incident logs into a clear management dashboard for incidents, alert investigation, estimated loss, threat score, detection minutes, containment time,
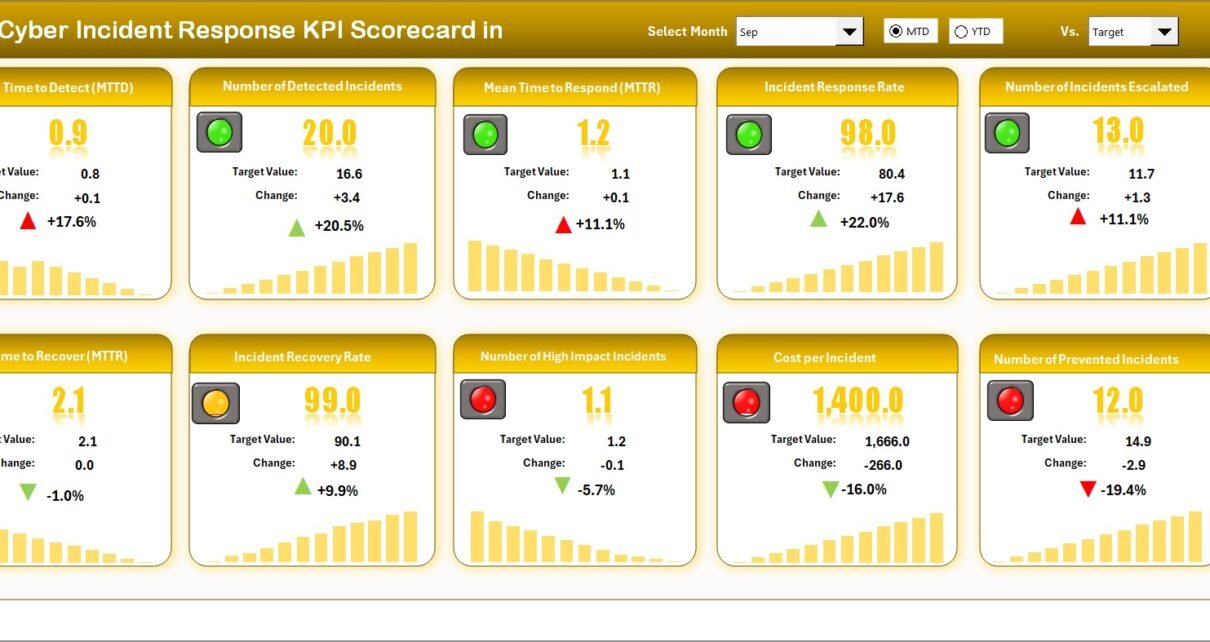
PKComments Off on Cyber Incident Response KPI Scorecard In Excel
Cyber threats continue to grow every day. Organizations now face ransomware attacks, phishing attempts, insider threats, and data breaches more frequently than ever before. Therefore, companies must not only protect
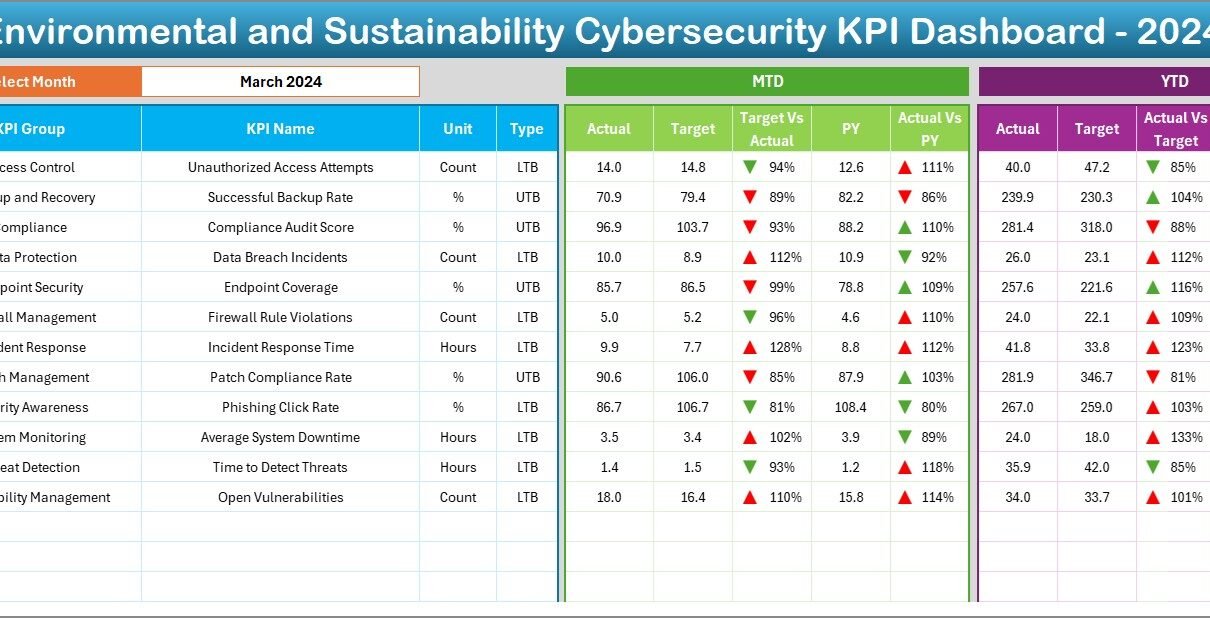
PKComments Off on Environmental and Sustainability Cybersecurity KPI Dashboard in Excel
In today’s world, cybersecurity and environmental sustainability are more connected than you might think. As organizations adopt green IT practices, they must also ensure that their cybersecurity measures align with
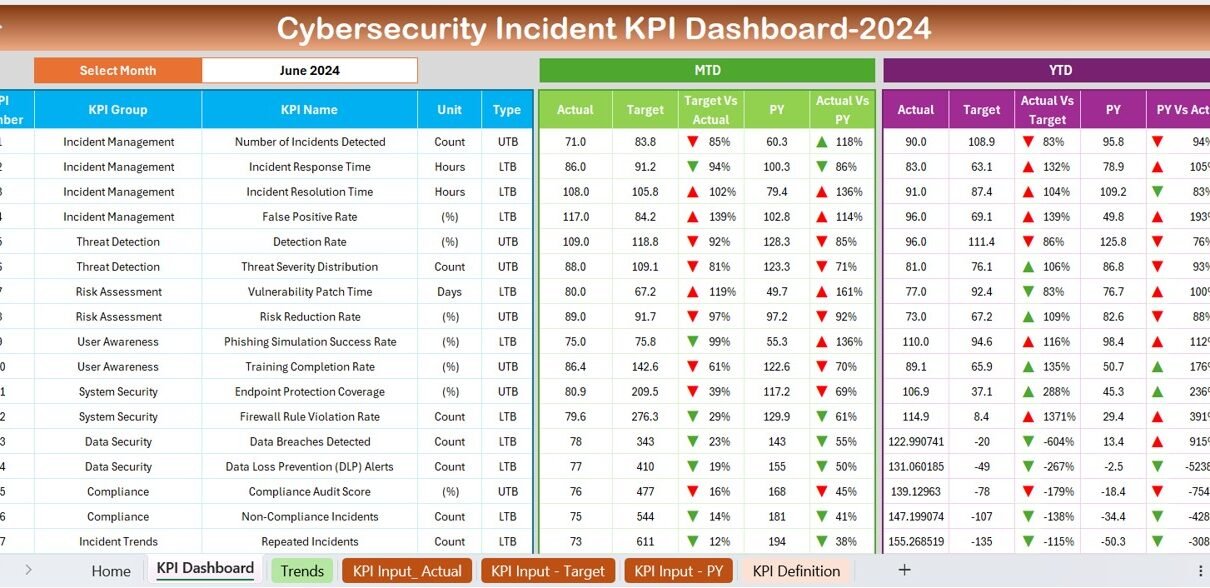
PKComments Off on Cybersecurity Incident KPI Dashboard in Excel
In today's fast-paced digital world, managing cybersecurity incidents effectively is critical for maintaining a secure IT infrastructure. Tracking the right Key Performance Indicators (KPIs) can help you monitor, analyze, and