New: NextGenTemplates Academy - video courses on Excel formulas with AI and Pivot Tables & dashboards. Early-bird: 20% off with code EARLYBIRD20 - first 20 orders only. See the courses →
  • Learn Excel (Free Course)
    • 1. Shortcut Keys
    • 2. Fill & Flash Fill
    • 3. Find & Replace
    • 4. Sort & Filter
    • 5. Formulas & Functions
    • 6. Data Validation
    • 7. Conditional Formatting
    • 8. Basic Charts
    • 9. Advanced Charts
    • 10. Pivot Tables
    • 11. Excel Dashboards
    • 12. VBA Course
    • 13. Excel Formulas with AI
  • Templates
  • Tutorials
    • Charts and Visualization
    • VBA
    • Excel Tips and Tricks
    • Excel Dashboards
    • Power Pivot & DAX
  • Power BI
  • Template Store
    • Ready to Use Templates
  • Courses
  • Academy
    • Excel + AI Mastery: 100 Formulas
    • Excel Pivot Tables & Dashboards
  • About Us
  • Contact Us

PK: An Excel Expert

Transforming Data into Decisions
Tag: Dashboard Reporting

Power BI

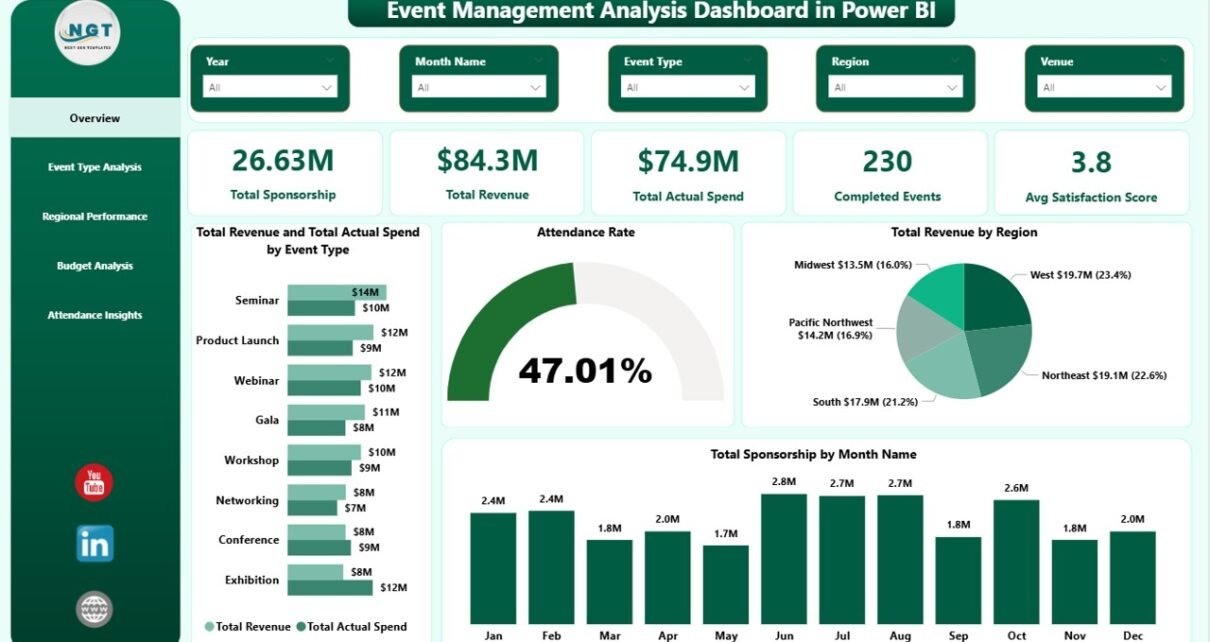
Event Management Analysis Dashboard in Power BI

April 20, 2026April 20, 2026 PKComments Off on Event Management Analysis Dashboard in Power BI
The Event Management Analysis Dashboard in Power BI is a 5-page .pbix template built for event managers who need to track sponsorship, revenue, spend, attendance, and satisfaction in one interactive
Read More
Dashboard Power BI

Backpacker Hostels Dashboard in Power BI

March 27, 2026March 27, 2026 PKComments Off on Backpacker Hostels Dashboard in Power BI
Managing a backpacker hostel can be challenging, especially when you deal with bookings, guest preferences, revenue tracking, and operational performance. However, when you use scattered data sources, it becomes difficult
Read More
Dashboard

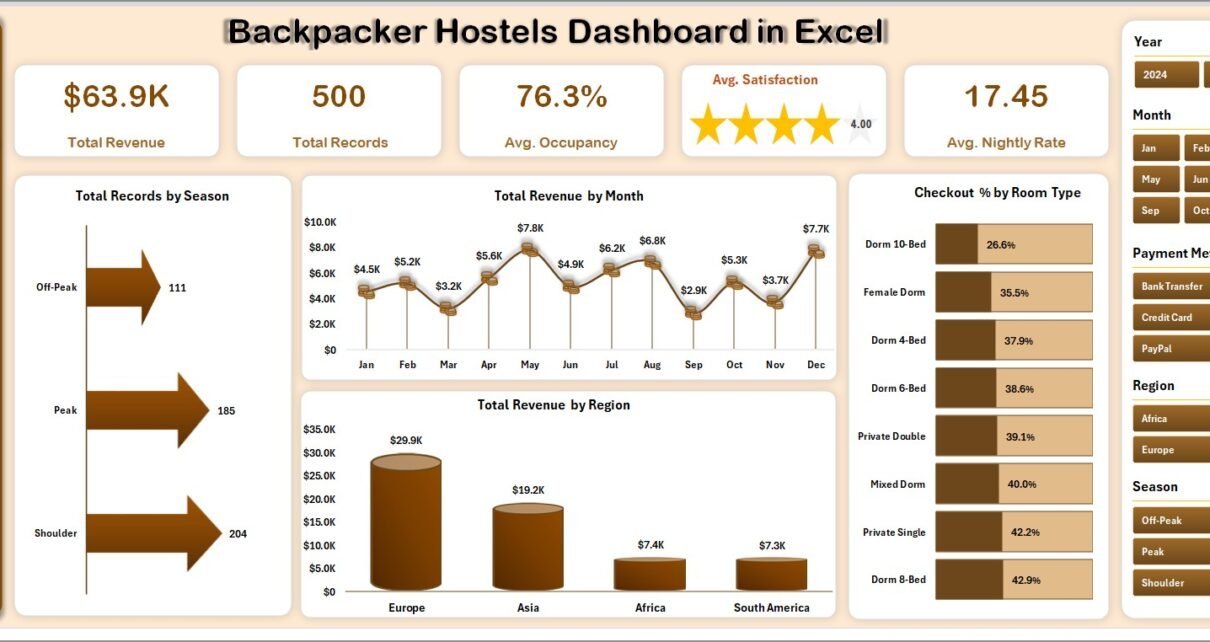
Backpacker Hostels Dashboard in Excel

March 27, 2026March 27, 2026 PKComments Off on Backpacker Hostels Dashboard in Excel
Managing a backpacker hostel can be exciting, but at the same time, it requires constant tracking of bookings, revenue, guest satisfaction, and occupancy. However, if you rely on scattered data
Read More
Power Pivot

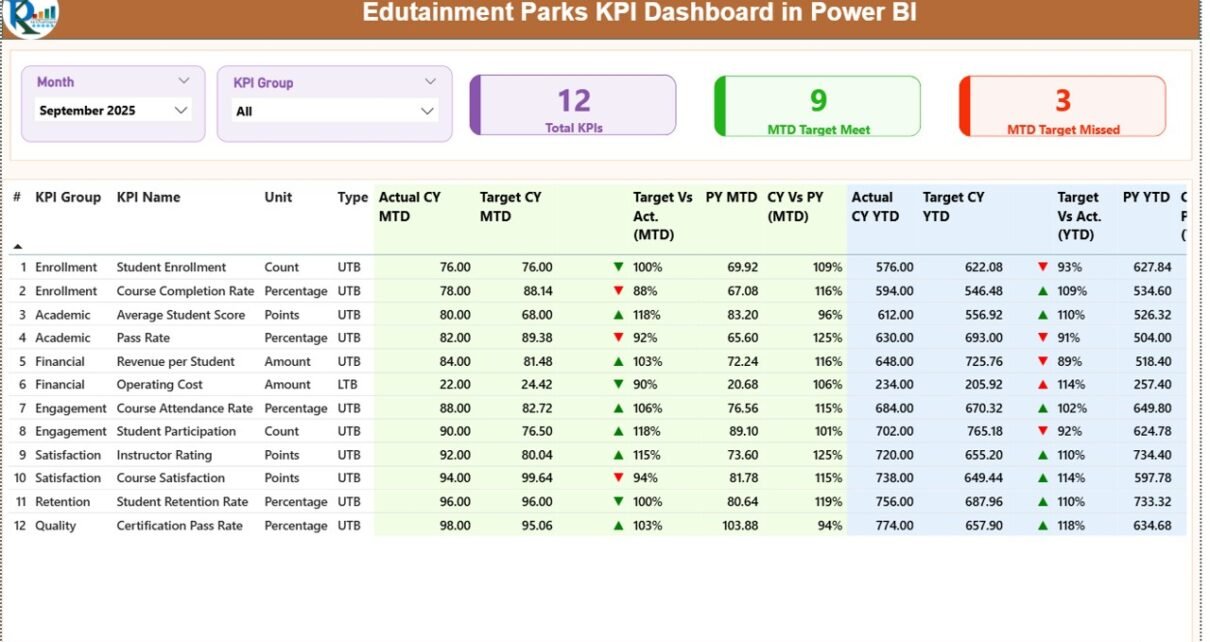
Edutainment Parks KPI Dashboard in Power BI

March 26, 2026March 26, 2026 PKComments Off on Edutainment Parks KPI Dashboard in Power BI
In today’s competitive entertainment industry, edutainment parks must balance fun, learning, and profitability. However, managing operations, tracking visitor performance, and analyzing revenue can quickly become overwhelming. So, how can you
Read More
Book Fairs Dashboard in Power BI
Dashboard Power BI

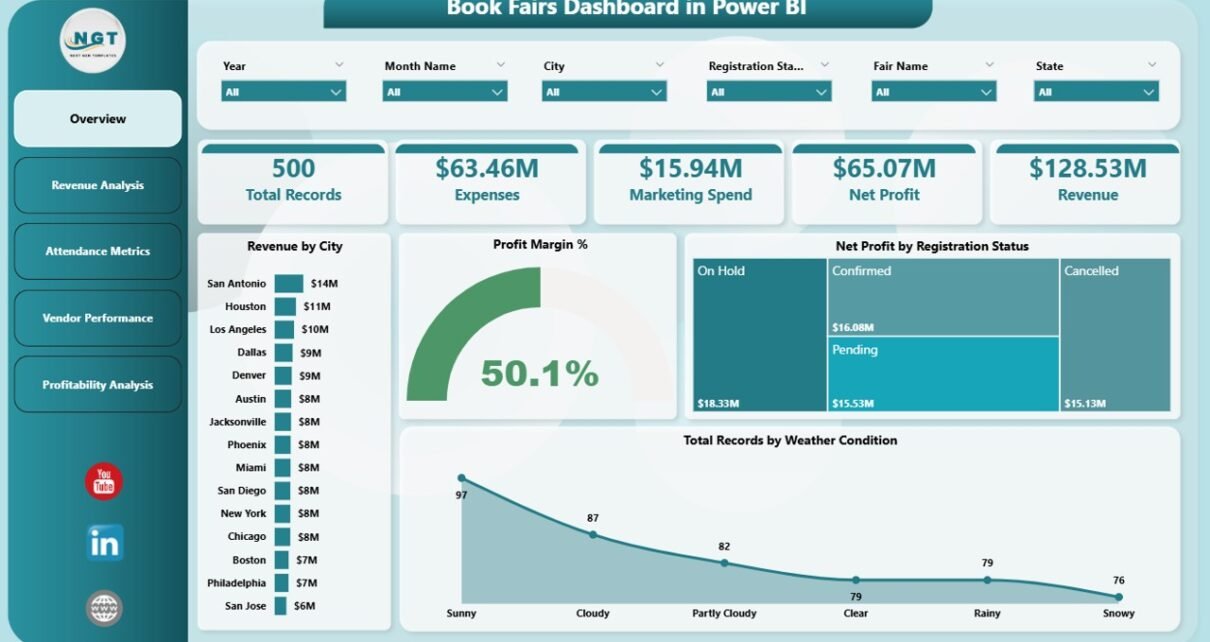
Book Fairs Dashboard in Power BI

March 20, 2026March 20, 2026 PKComments Off on Book Fairs Dashboard in Power BI
In today’s fast-growing event industry, book fairs generate massive amounts of data every single day. Organizers manage visitor attendance, vendor performance, ticket revenue, and profitability all at once. However, when
Read More
Dashboard Power BI

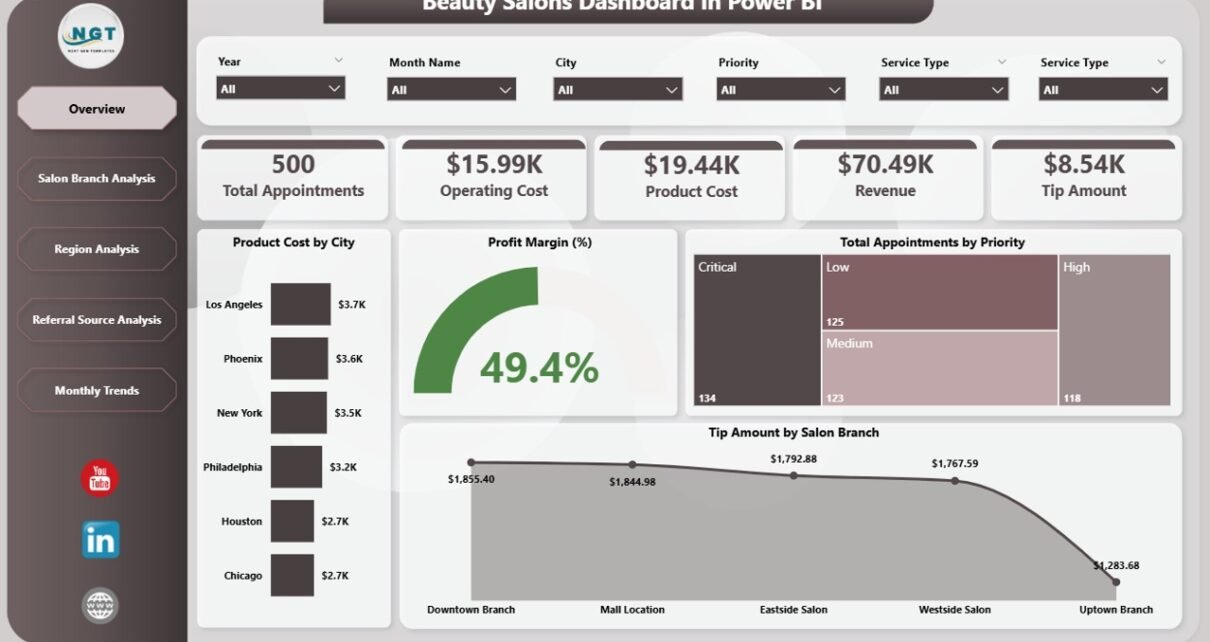
Beauty Salons Dashboard in Power BI

March 18, 2026March 18, 2026 PKComments Off on Beauty Salons Dashboard in Power BI
In today’s fast-growing beauty industry, salon owners must track performance, manage costs, and understand customer trends quickly. However, many salons still rely on scattered spreadsheets and manual reports. As a
Read More
Dashboard Power BI

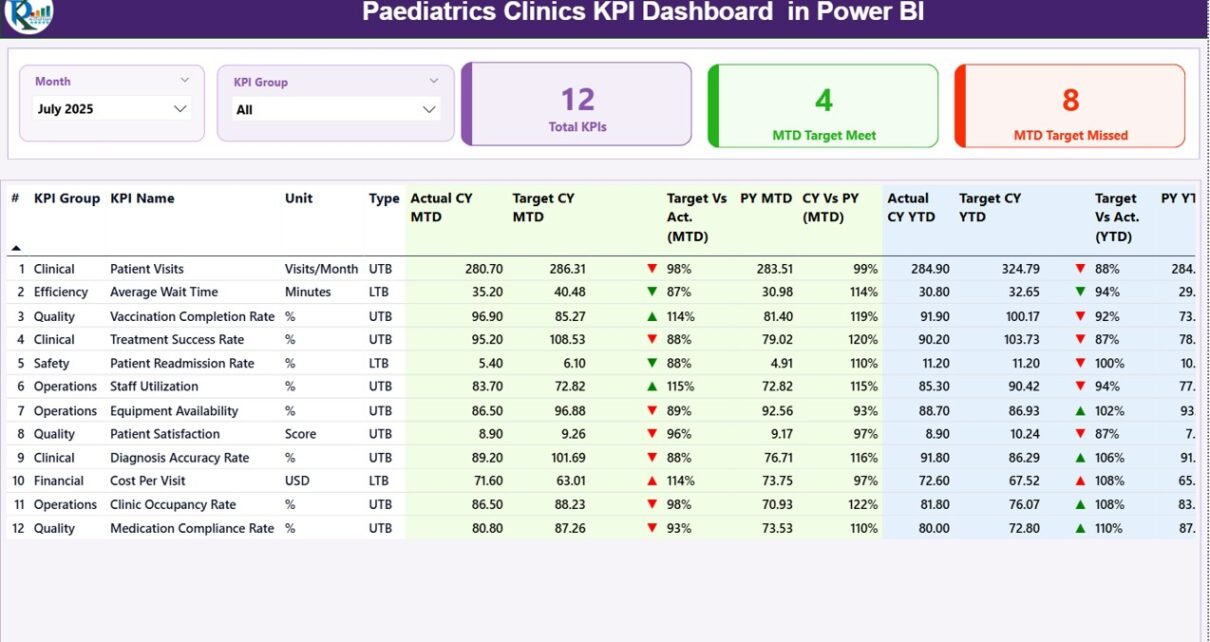
Paediatrics Clinics KPI Dashboard in Power BI

March 17, 2026March 17, 2026 PKComments Off on Paediatrics Clinics KPI Dashboard in Power BI
Managing a paediatrics clinic requires precision, care, and timely decision-making. Clinics deal with sensitive patient data, treatment outcomes, appointment schedules, and operational efficiency daily. However, many clinics still rely on
Read More
Dashboard Power BI

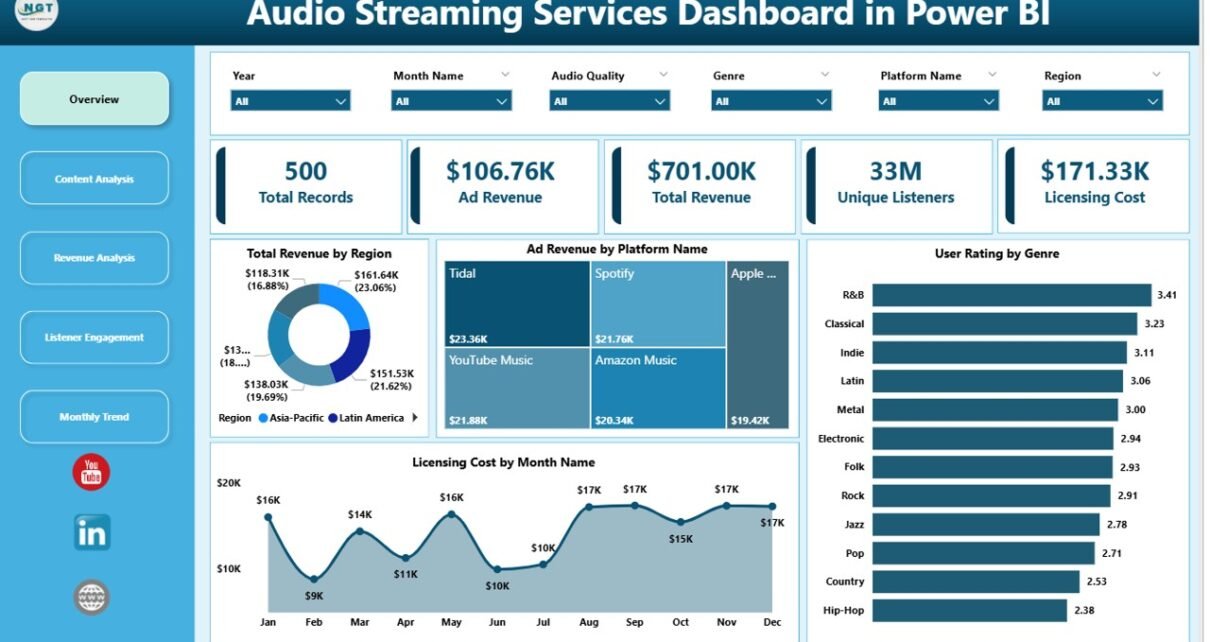
Audio Streaming Services Dashboard in Power BI

March 14, 2026March 14, 2026 PKComments Off on Audio Streaming Services Dashboard in Power BI
The digital music industry has experienced massive growth over the last decade. Millions of users now listen to music, podcasts, and audio content through online streaming platforms every day. Services
Read More
Dashboard Power BI

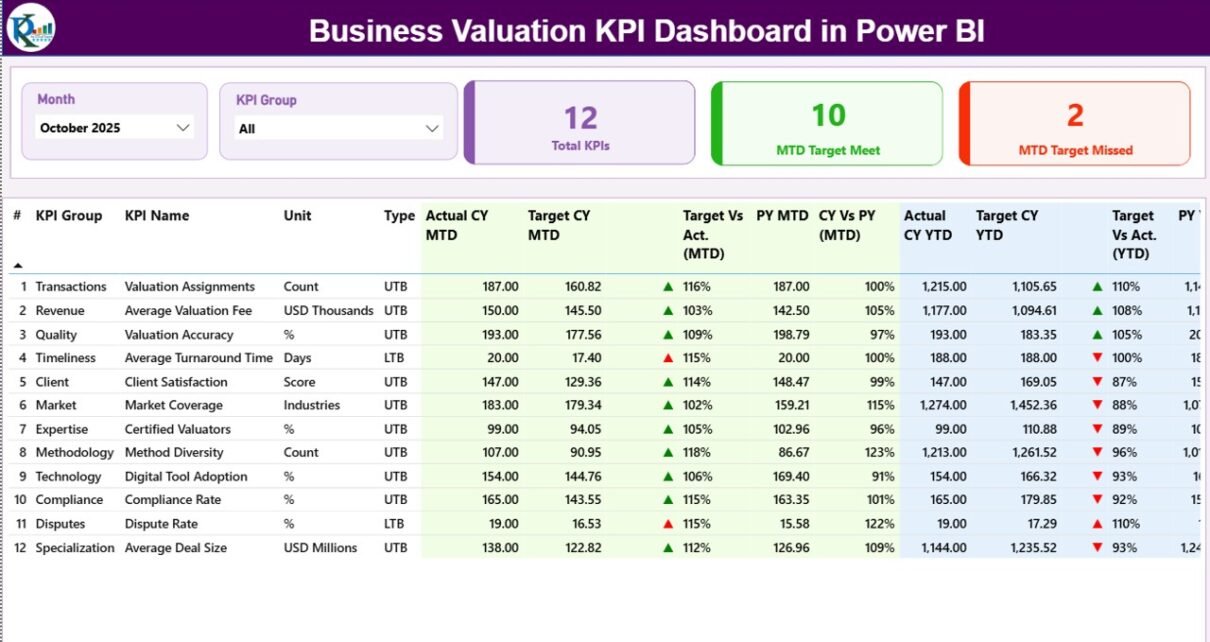
Business Valuation KPI Dashboard in Power BI

March 11, 2026March 11, 2026 PKComments Off on Business Valuation KPI Dashboard in Power BI
In today’s competitive business environment, organizations must monitor financial performance, valuation metrics, and strategic indicators regularly. Business valuation professionals, financial analysts, investors, and consulting firms depend on accurate performance tracking
Read More
Dashboard Power BI

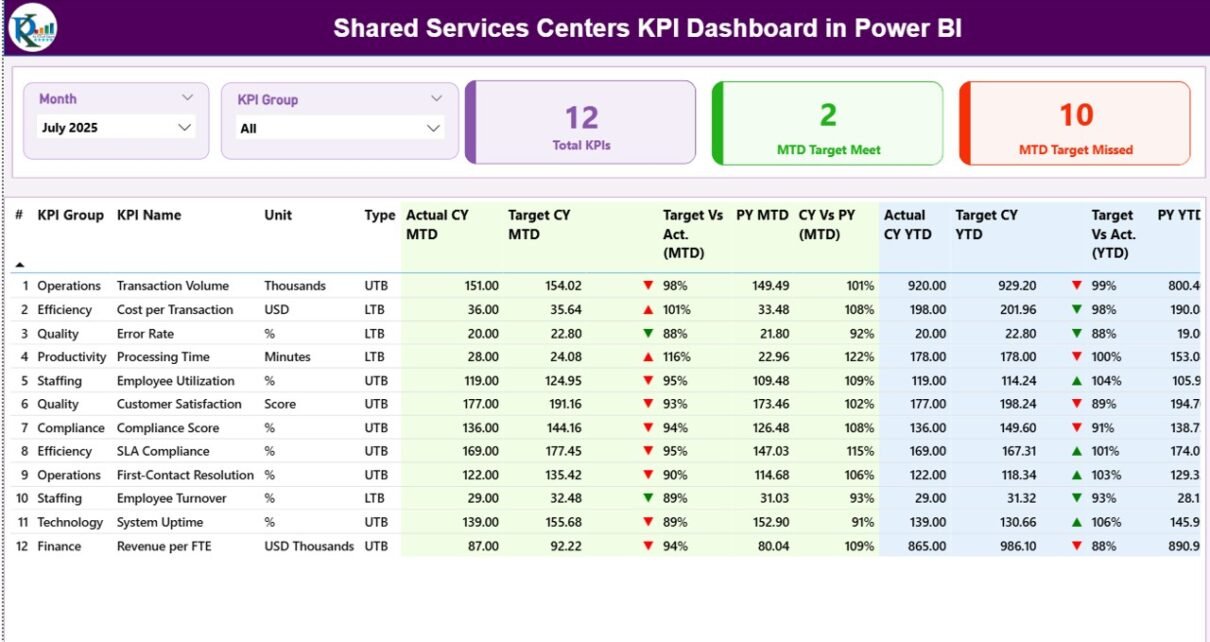
Shared Services Centers KPI Dashboard in Power BI

March 10, 2026March 10, 2026 PKComments Off on Shared Services Centers KPI Dashboard in Power BI
Modern organizations rely heavily on Shared Services Centers (SSC) to centralize critical business functions such as finance, HR, procurement, IT support, and customer service. Because these centers handle large volumes
Read More

Posts pagination

1 2 3 Next
  • Learn Excel (Free Course)
    • 1. Shortcut Keys
    • 2. Fill & Flash Fill
    • 3. Find & Replace
    • 4. Sort & Filter
    • 5. Formulas & Functions
    • 6. Data Validation
    • 7. Conditional Formatting
    • 8. Basic Charts
    • 9. Advanced Charts
    • 10. Pivot Tables
    • 11. Excel Dashboards
    • 12. VBA Course
    • 13. Excel Formulas with AI
  • Templates
  • Tutorials
    • Charts and Visualization
    • VBA
    • Excel Tips and Tricks
    • Excel Dashboards
    • Power Pivot & DAX
  • Power BI
  • Template Store
    • Ready to Use Templates
  • Courses
  • Academy
    • Excel + AI Mastery: 100 Formulas
    • Excel Pivot Tables & Dashboards
  • About Us
  • Contact Us
Copyright © 2023 PK-AnExcelExpert.com - Privacy Policy