New: NextGenTemplates Academy - video courses on Excel formulas with AI and Pivot Tables & dashboards. Early-bird: 20% off with code EARLYBIRD20 - first 20 orders only. See the courses →
  • Learn Excel (Free Course)
    • 1. Shortcut Keys
    • 2. Fill & Flash Fill
    • 3. Find & Replace
    • 4. Sort & Filter
    • 5. Formulas & Functions
    • 6. Data Validation
    • 7. Conditional Formatting
    • 8. Basic Charts
    • 9. Advanced Charts
    • 10. Pivot Tables
    • 11. Excel Dashboards
    • 12. VBA Course
    • 13. Excel Formulas with AI
  • Templates
  • Tutorials
    • Charts and Visualization
    • VBA
    • Excel Tips and Tricks
    • Excel Dashboards
    • Power Pivot & DAX
  • Power BI
  • Template Store
    • Ready to Use Templates
  • Courses
  • Academy
    • Excel + AI Mastery: 100 Formulas
    • Excel Pivot Tables & Dashboards
  • About Us
  • Contact Us

PK: An Excel Expert

Transforming Data into Decisions

Tag: Data Visualization Excel

Dashboard

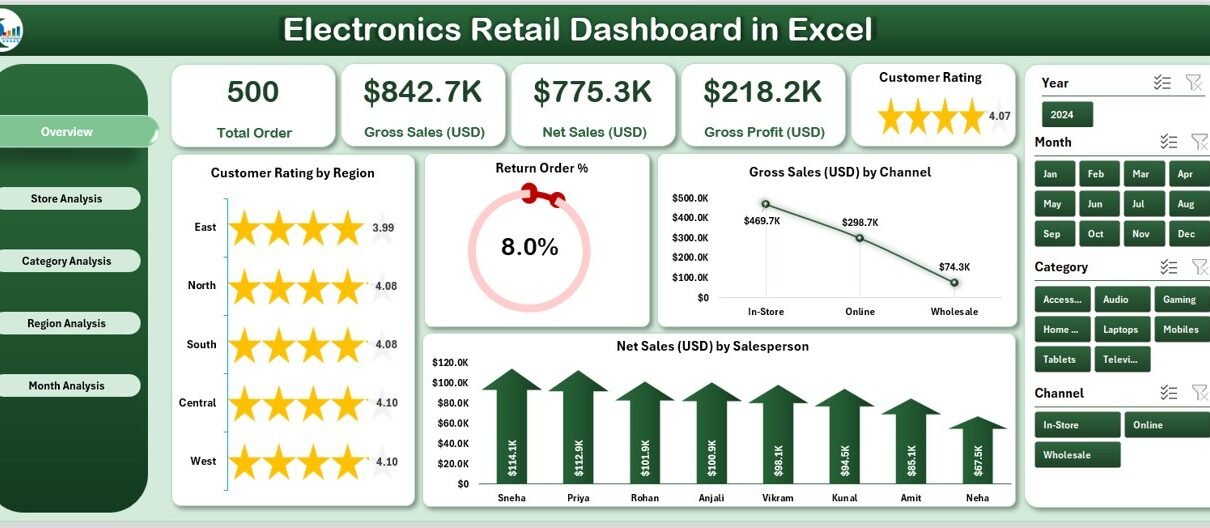
Electronics Retail Dashboard in Excel

November 17, 2025November 17, 2025 PKComments Off on Electronics Retail Dashboard in Excel
The electronics retail industry moves fast. Prices shift daily, customer preferences change quickly, and sales trends vary across stores, categories, and regions. Because of this constant change, business owners need
Read More
Dashboard

Venture Capital Dashboard in Excel

November 16, 2025November 16, 2025 PKComments Off on Venture Capital Dashboard in Excel
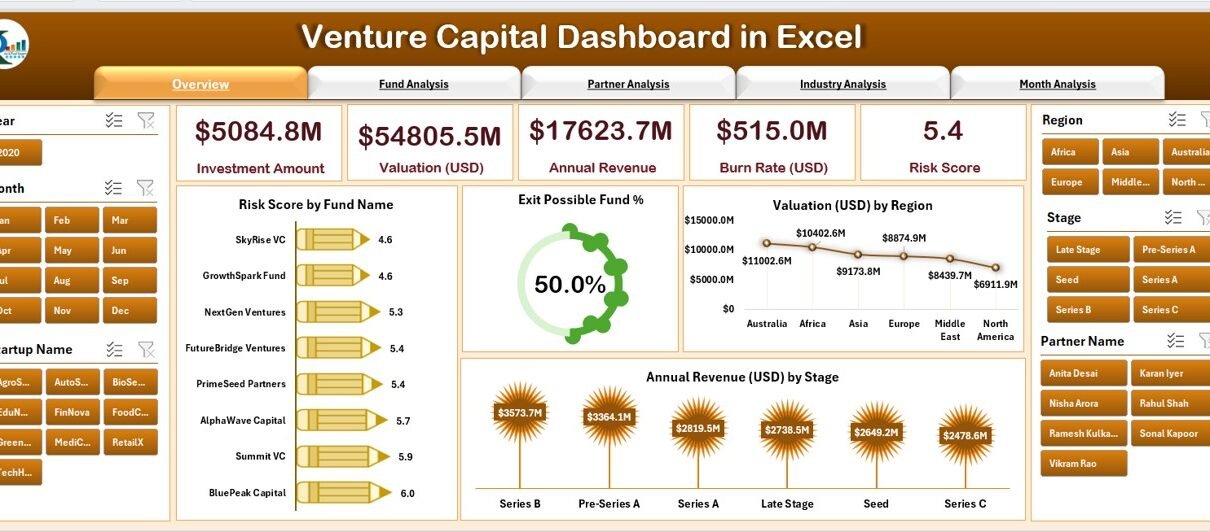
Venture capital teams handle high-value investments, portfolio risks, fund performance tracking, partner reviews, and industry trend analysis every day. Because of this, they need a clear and organized way to
Read More
Dashboard

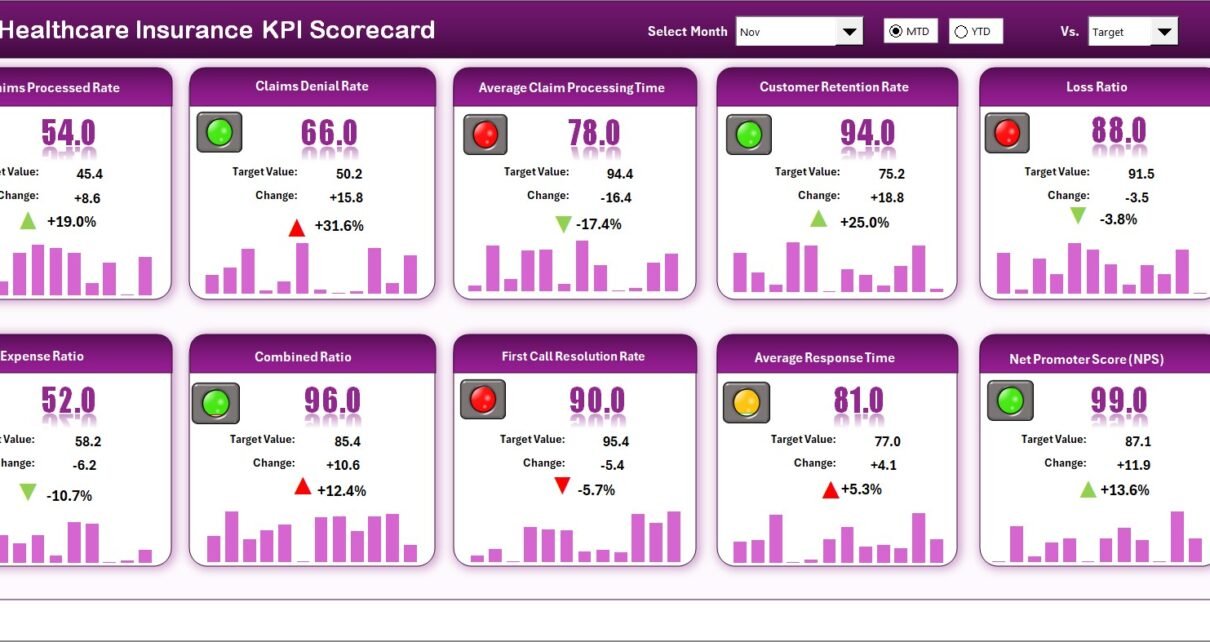
Healthcare Insurance KPI Scorecard in Excel

October 31, 2025October 31, 2025 PKComments Off on Healthcare Insurance KPI Scorecard in Excel
Managing performance in the healthcare insurance sector requires precision, transparency, and real-time insights. Whether you are a health insurer, claims manager, or financial analyst, tracking the right Key Performance Indicators
Read More
Dashboard

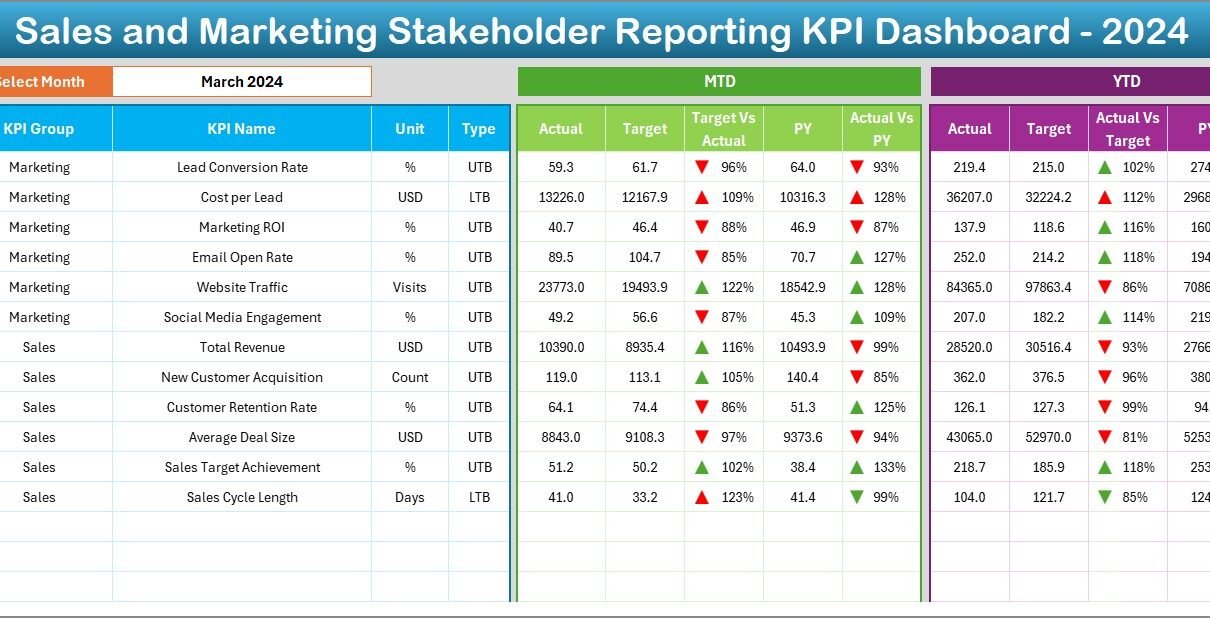
Sales and Marketing Stakeholder Reporting KPI Dashboard in Excel

April 17, 2025April 17, 2025 PKComments Off on Sales and Marketing Stakeholder Reporting KPI Dashboard in Excel
In today’s fast-paced business world, stakeholders need clear, visual, and actionable insights. That’s where a Sales and Marketing Stakeholder Reporting KPI Dashboard in Excel becomes a game changer. If you’re
Read More
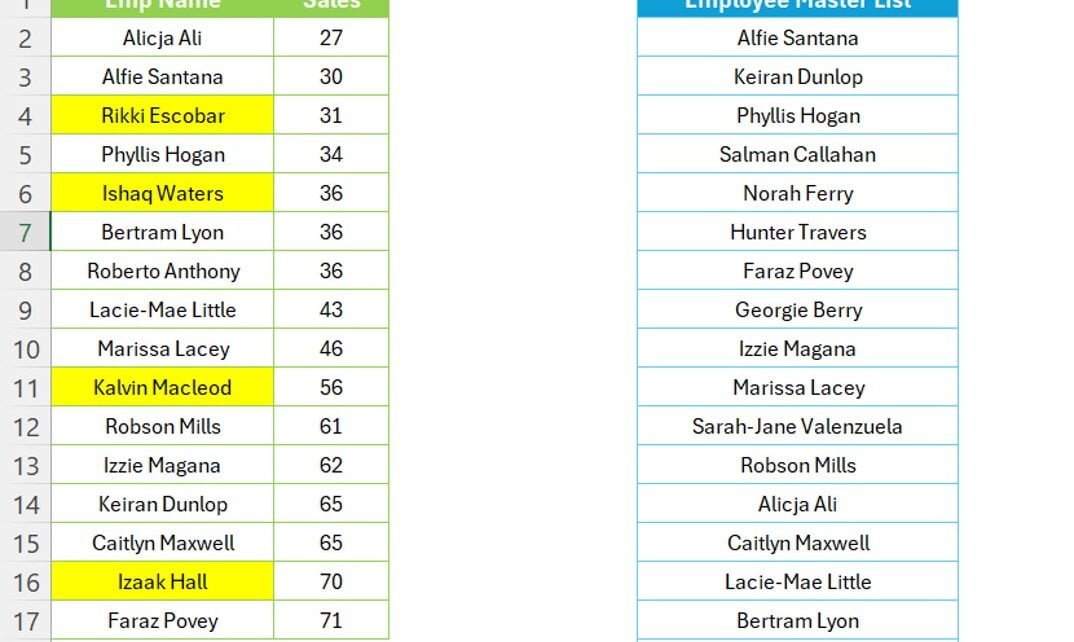
Match List using Conditional Formatting
Excel Tips and Tricks

Excel’s Conditional Formatting Magic!

December 25, 2023October 10, 2026 PKComments Off on Excel’s Conditional Formatting Magic!
Introduction Welcome to our deep dive into one of Excel's most powerful features - Conditional Formatting. This tool isn't just a feature; it's a magic wand in your Excel arsenal,
Read More

Posts pagination

Previous 1 2 3
  • Learn Excel (Free Course)
    • 1. Shortcut Keys
    • 2. Fill & Flash Fill
    • 3. Find & Replace
    • 4. Sort & Filter
    • 5. Formulas & Functions
    • 6. Data Validation
    • 7. Conditional Formatting
    • 8. Basic Charts
    • 9. Advanced Charts
    • 10. Pivot Tables
    • 11. Excel Dashboards
    • 12. VBA Course
    • 13. Excel Formulas with AI
  • Templates
  • Tutorials
    • Charts and Visualization
    • VBA
    • Excel Tips and Tricks
    • Excel Dashboards
    • Power Pivot & DAX
  • Power BI
  • Template Store
    • Ready to Use Templates
  • Courses
  • Academy
    • Excel + AI Mastery: 100 Formulas
    • Excel Pivot Tables & Dashboards
  • About Us
  • Contact Us
Copyright © 2023 PK-AnExcelExpert.com - Privacy Policy