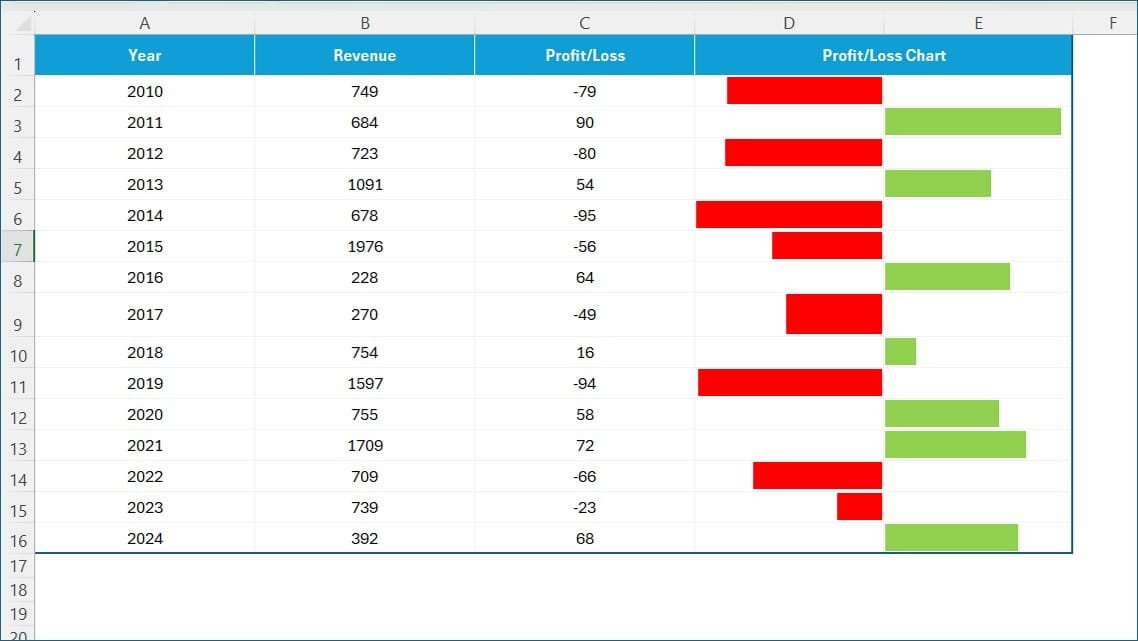
Profit and Loss Chart in Excel with Examples
Do you want to learn how to visually display Profit and Loss Chart in Excel, highlighting positive and negative values clearly? With Excel’s IF function and conditional formatting, it’s easier
Transforming Data into Decisions