New: NextGenTemplates Academy - video courses on Excel formulas with AI and Pivot Tables & dashboards. Early-bird: 20% off with code EARLYBIRD20 - first 20 orders only. See the courses →
  • Learn Excel (Free Course)
    • 1. Shortcut Keys
    • 2. Fill & Flash Fill
    • 3. Find & Replace
    • 4. Sort & Filter
    • 5. Formulas & Functions
    • 6. Data Validation
    • 7. Conditional Formatting
    • 8. Basic Charts
    • 9. Advanced Charts
    • 10. Pivot Tables
    • 11. Excel Dashboards
    • 12. VBA Course
    • 13. Excel Formulas with AI
  • Templates
  • Tutorials
    • Charts and Visualization
    • VBA
    • Excel Tips and Tricks
    • Excel Dashboards
    • Power Pivot & DAX
  • Power BI
  • Template Store
    • Ready to Use Templates
  • Courses
  • Academy
    • Excel + AI Mastery: 100 Formulas
    • Excel Pivot Tables & Dashboards
  • About Us
  • Contact Us

PK: An Excel Expert

Transforming Data into Decisions

Tag: E-commerce analytics

Dashboard Power BI

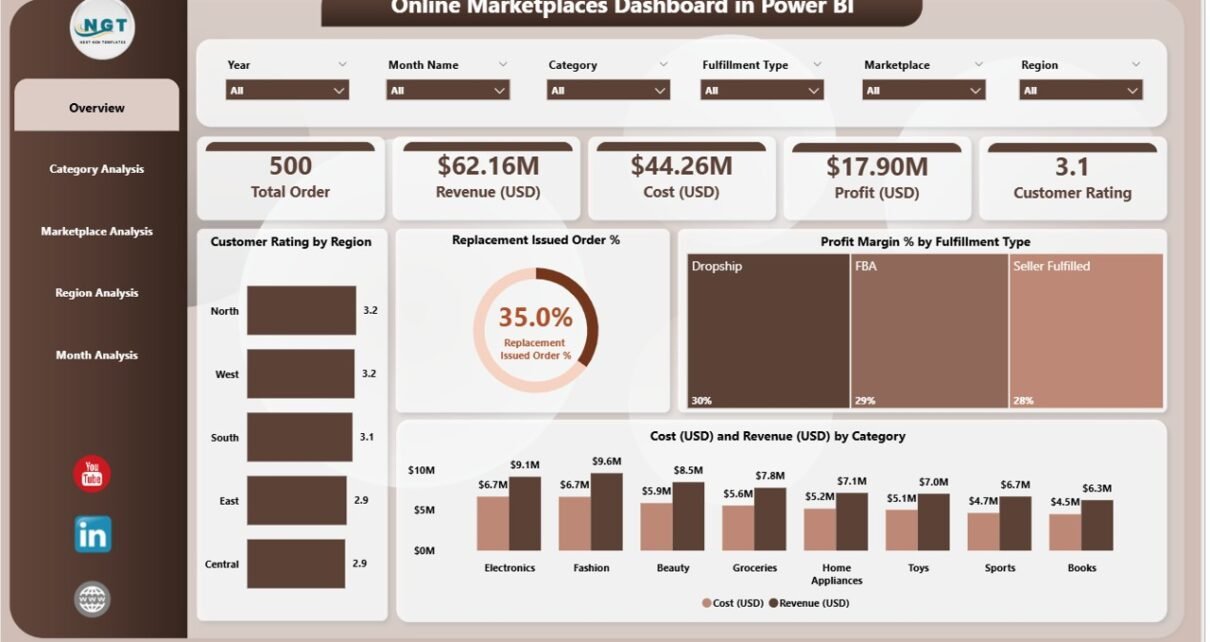
Online Marketplaces Dashboard in Power BI

November 27, 2025November 27, 2025 PKComments Off on Online Marketplaces Dashboard in Power BI
In today's fast-paced e-commerce environment, online marketplaces play a critical role in driving revenue and customer engagement. Businesses need a way to track their performance, identify trends, and make data-driven
Read More
Dashboard

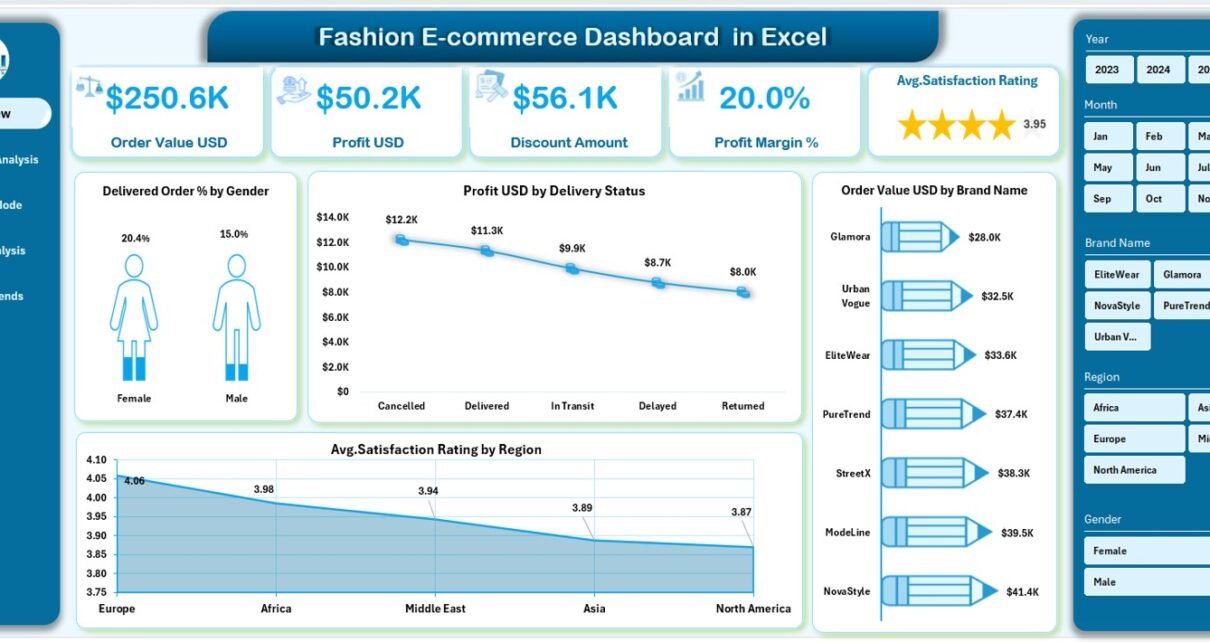
Fashion E-commerce Dashboard in Excel

November 11, 2025November 11, 2025 PKComments Off on Fashion E-commerce Dashboard in Excel
In the fast-moving world of online fashion retail, every sale, discount, and return provides valuable insight into customer behavior and business performance. However, managing these data points manually can become
Read More
Dashboard

Retail and E-commerce Operations KPI Dashboard in Excel

June 12, 2025June 12, 2025 PKComments Off on Retail and E-commerce Operations KPI Dashboard in Excel
In today’s fast-paced retail and e-commerce landscape, staying ahead of the competition demands constant vigilance over key performance indicators (KPIs). With sales channels multiplying and customer expectations rising, you need
Read More
Dashboard Power BI

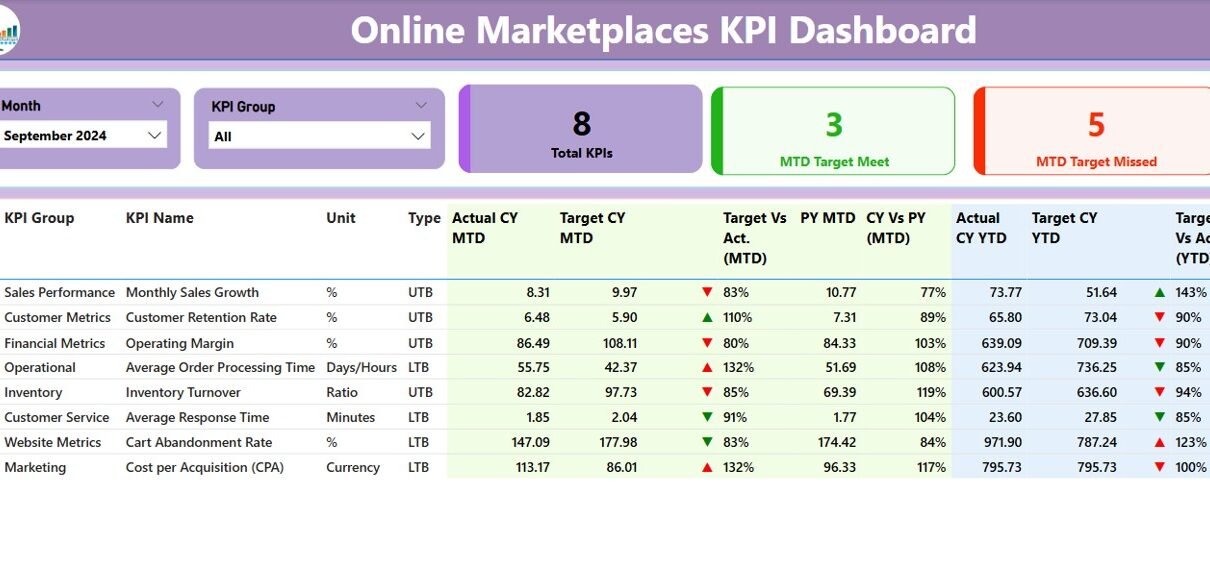
Online Marketplaces KPI Dashboard in Power BI

June 7, 2025June 7, 2025 PKComments Off on Online Marketplaces KPI Dashboard in Power BI
Tracking key performance indicators (KPIs) is crucial for running successful online marketplaces. Whether you're managing multiple sellers, tracking conversion rates, or optimizing customer satisfaction, having a centralized system to monitor
Read More
Power BI

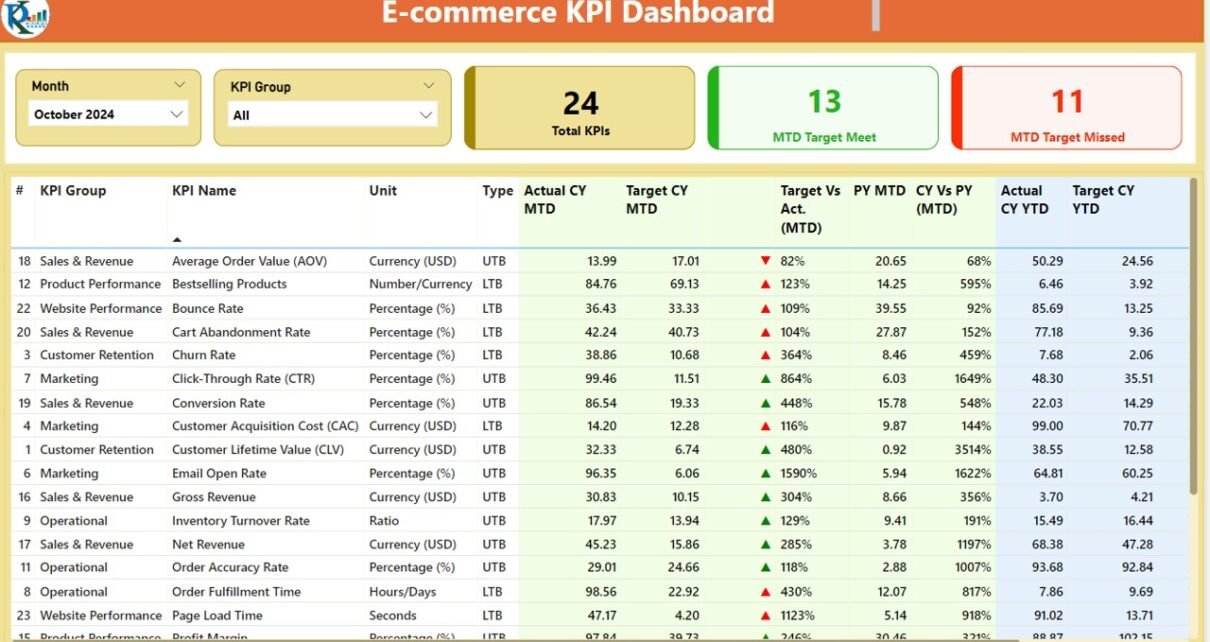
E-commerce KPI Dashboard in Power BI

January 18, 2025March 24, 2025 PKComments Off on E-commerce KPI Dashboard in Power BI
In the fast-paced world of e-commerce, businesses need to constantly track key performance indicators (KPIs) to measure success, optimize strategies, and stay competitive. With the E-commerce KPI Dashboard in Power
Read More
Sales Funnel infographic Chart
Charts and Visualization

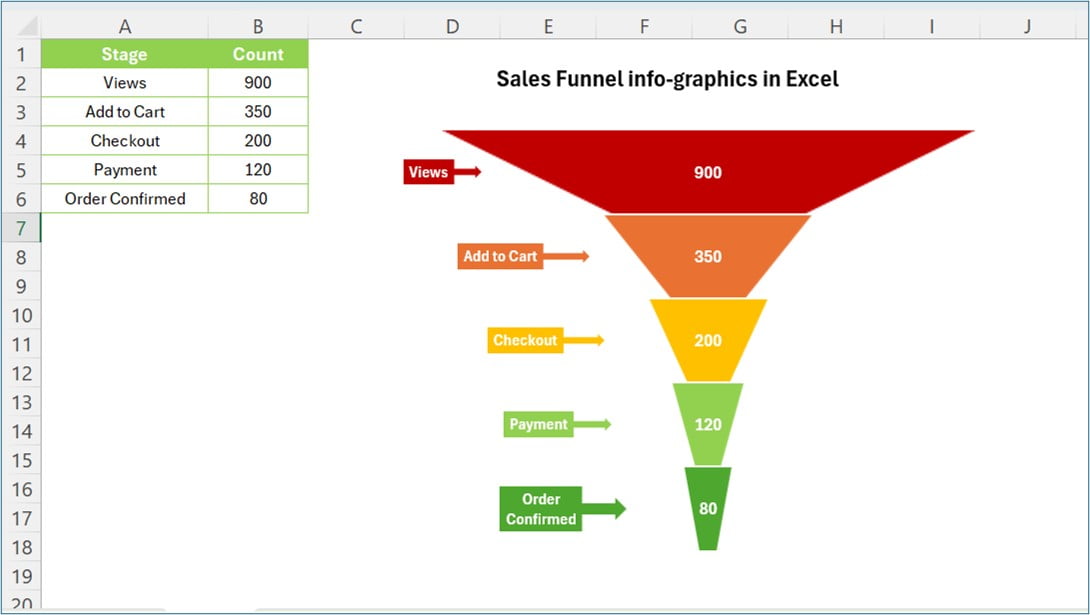
Sales funnel infographic chart in Excel

February 17, 2024February 23, 2025 PKComments Off on Sales funnel infographic chart in Excel
We can enhance your understanding of your sales process using our latest Sales funnel infographic chart in Excel. In this article we will guide you through the steps of transforming
Read More
  • Learn Excel (Free Course)
    • 1. Shortcut Keys
    • 2. Fill & Flash Fill
    • 3. Find & Replace
    • 4. Sort & Filter
    • 5. Formulas & Functions
    • 6. Data Validation
    • 7. Conditional Formatting
    • 8. Basic Charts
    • 9. Advanced Charts
    • 10. Pivot Tables
    • 11. Excel Dashboards
    • 12. VBA Course
    • 13. Excel Formulas with AI
  • Templates
  • Tutorials
    • Charts and Visualization
    • VBA
    • Excel Tips and Tricks
    • Excel Dashboards
    • Power Pivot & DAX
  • Power BI
  • Template Store
    • Ready to Use Templates
  • Courses
  • Academy
    • Excel + AI Mastery: 100 Formulas
    • Excel Pivot Tables & Dashboards
  • About Us
  • Contact Us
Copyright © 2023 PK-AnExcelExpert.com - Privacy Policy