New: NextGenTemplates Academy - video courses on Excel formulas with AI and Pivot Tables & dashboards. Early-bird: 20% off with code EARLYBIRD20 - first 20 orders only. See the courses →
  • Learn Excel (Free Course)
    • 1. Shortcut Keys
    • 2. Fill & Flash Fill
    • 3. Find & Replace
    • 4. Sort & Filter
    • 5. Formulas & Functions
    • 6. Data Validation
    • 7. Conditional Formatting
    • 8. Basic Charts
    • 9. Advanced Charts
    • 10. Pivot Tables
    • 11. Excel Dashboards
    • 12. VBA Course
    • 13. Excel Formulas with AI
  • Templates
  • Tutorials
    • Charts and Visualization
    • VBA
    • Excel Tips and Tricks
    • Excel Dashboards
    • Power Pivot & DAX
  • Power BI
  • Template Store
    • Ready to Use Templates
  • Courses
  • Academy
    • Excel + AI Mastery: 100 Formulas
    • Excel Pivot Tables & Dashboards
  • About Us
  • Contact Us

PK: An Excel Expert

Transforming Data into Decisions

Tag: Election Commissions Analytics

Dashboard Templates

Election Commissions Dashboard in Excel

September 11, 2026September 11, 2026 PKComments Off on Election Commissions Dashboard in Excel
Election administration produces an enormous amount of data and almost none of it arrives in one place. Turnout comes from the returning officers. Expenditure comes from the accounts branch. Complaints
Read More
Dashboard

Political Campaign Dashboard in Power BI

May 16, 2026May 16, 2026 PKComments Off on Political Campaign Dashboard in Power BI
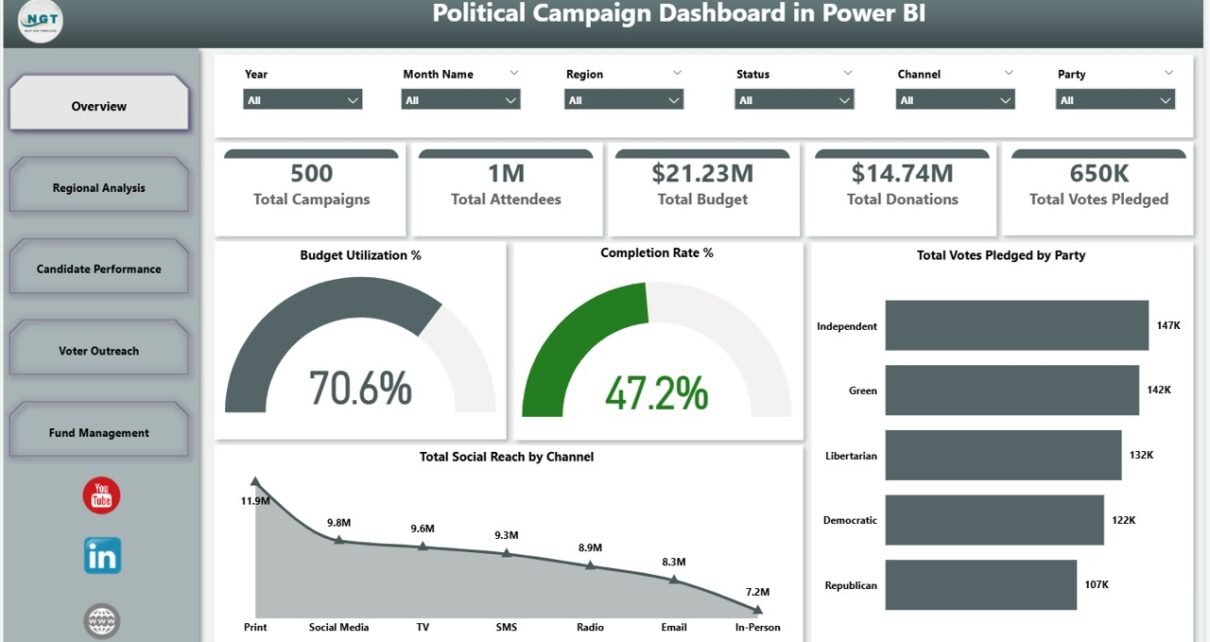
The Political Campaign Dashboard in Power BI tracks 5 headline campaign KPIs across 5 interactive report pages, with 16+ pre-built Power BI visuals and cross-filter slicers wired through a single
Read More
Dashboard

Political Campaign Dashboard in Excel

May 2, 2026May 14, 2026 PKComments Off on Political Campaign Dashboard in Excel
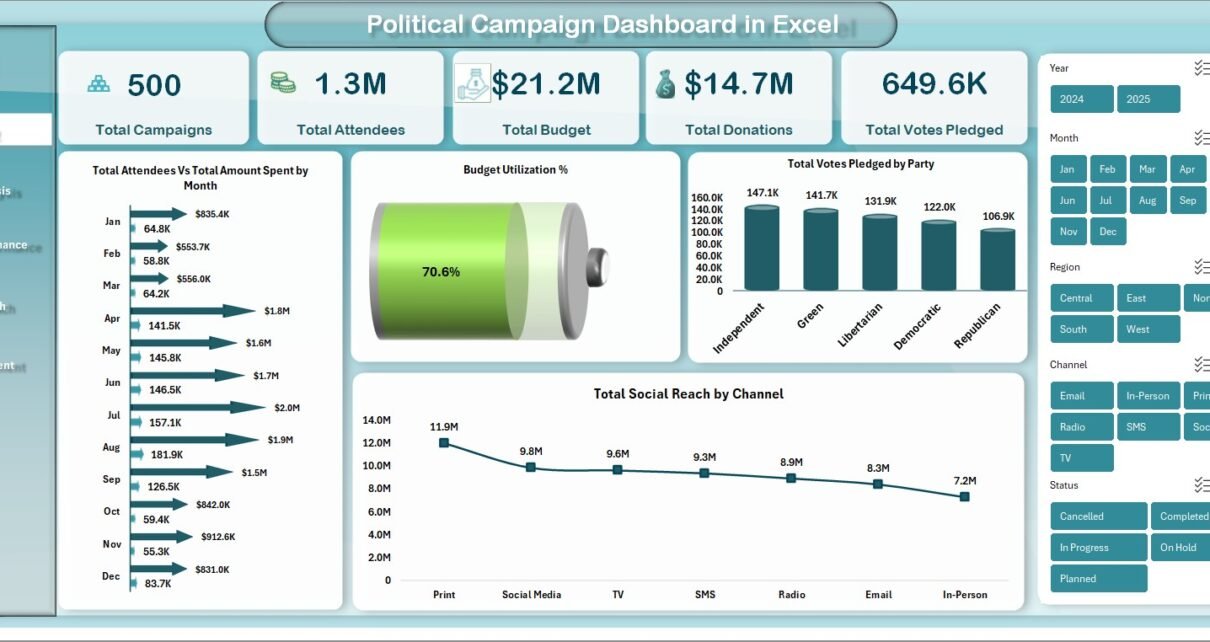
The Political Campaign Dashboard in Excel tracks 5 headline campaign KPIs across 5 interactive dashboard pages, with 14+ pre-built pivot charts, a structured Data Sheet, and a Support Sheet that
Read More
Dashboard Power BI

Election Commissions KPI Dashboard in Power BI

February 13, 2026February 13, 2026 PKComments Off on Election Commissions KPI Dashboard in Power BI
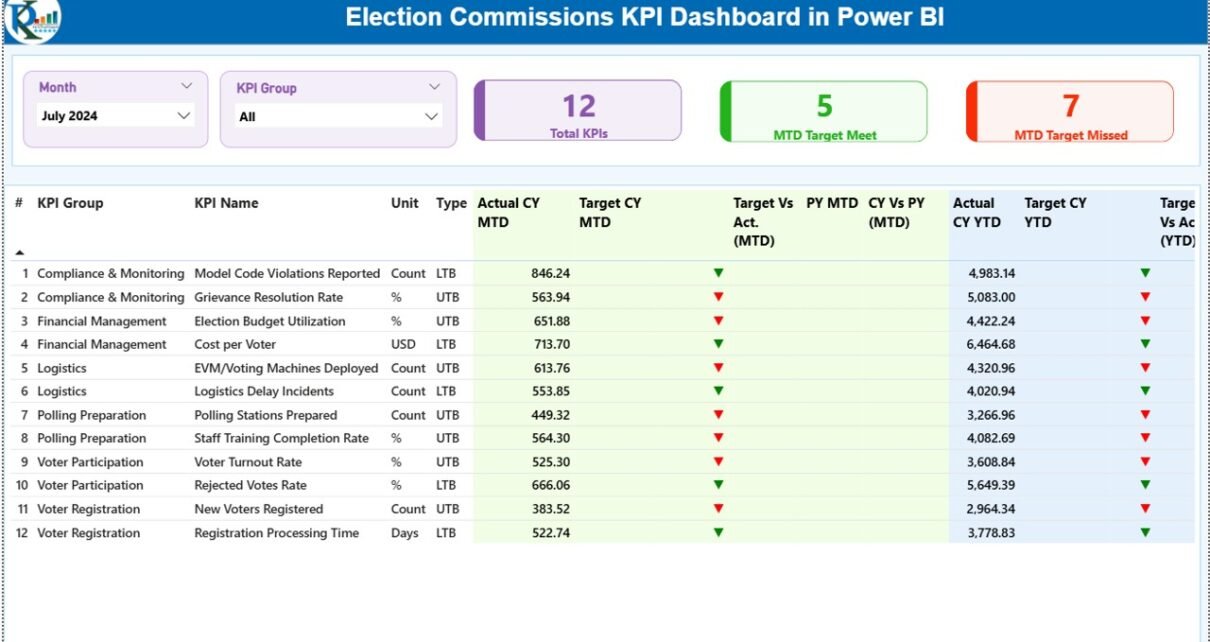
Free, fair, and transparent elections build trust in democracy. However, election bodies often struggle with scattered reports, delayed updates, and manual tracking. As a result, decision-makers cannot see real-time performance.So,
Read More
  • Learn Excel (Free Course)
    • 1. Shortcut Keys
    • 2. Fill & Flash Fill
    • 3. Find & Replace
    • 4. Sort & Filter
    • 5. Formulas & Functions
    • 6. Data Validation
    • 7. Conditional Formatting
    • 8. Basic Charts
    • 9. Advanced Charts
    • 10. Pivot Tables
    • 11. Excel Dashboards
    • 12. VBA Course
    • 13. Excel Formulas with AI
  • Templates
  • Tutorials
    • Charts and Visualization
    • VBA
    • Excel Tips and Tricks
    • Excel Dashboards
    • Power Pivot & DAX
  • Power BI
  • Template Store
    • Ready to Use Templates
  • Courses
  • Academy
    • Excel + AI Mastery: 100 Formulas
    • Excel Pivot Tables & Dashboards
  • About Us
  • Contact Us
Copyright © 2023 PK-AnExcelExpert.com - Privacy Policy