New: NextGenTemplates Academy - video courses on Excel formulas with AI and Pivot Tables & dashboards. Early-bird: 20% off with code EARLYBIRD20 - first 20 orders only. See the courses →
  • Learn Excel (Free Course)
    • 1. Shortcut Keys
    • 2. Fill & Flash Fill
    • 3. Find & Replace
    • 4. Sort & Filter
    • 5. Formulas & Functions
    • 6. Data Validation
    • 7. Conditional Formatting
    • 8. Basic Charts
    • 9. Advanced Charts
    • 10. Pivot Tables
    • 11. Excel Dashboards
    • 12. VBA Course
    • 13. Excel Formulas with AI
  • Templates
  • Tutorials
    • Charts and Visualization
    • VBA
    • Excel Tips and Tricks
    • Excel Dashboards
    • Power Pivot & DAX
  • Power BI
  • Template Store
    • Ready to Use Templates
  • Courses
  • Academy
    • Excel + AI Mastery: 100 Formulas
    • Excel Pivot Tables & Dashboards
  • About Us
  • Contact Us

PK: An Excel Expert

Transforming Data into Decisions

Tag: energy analytics

Power BI Templates

Geothermal Energy Dashboard in Power BI

June 17, 2026June 17, 2026 PKComments Off on Geothermal Energy Dashboard in Power BI
Geothermal energy teams often manage long-running plant assets, high capital costs, regional operating differences, and sustainability targets at the same time. The Geothermal Energy Dashboard in Power BI gives those
Read More
Dashboard Templates

Geothermal Energy Dashboard in Excel

June 17, 2026June 17, 2026 PKComments Off on Geothermal Energy Dashboard in Excel
Geothermal projects can run continuously for decades, but the reporting work around them is often less elegant: revenue in one spreadsheet, plant generation in another, capacity planning in a third,
Read More
Dashboard Power BI

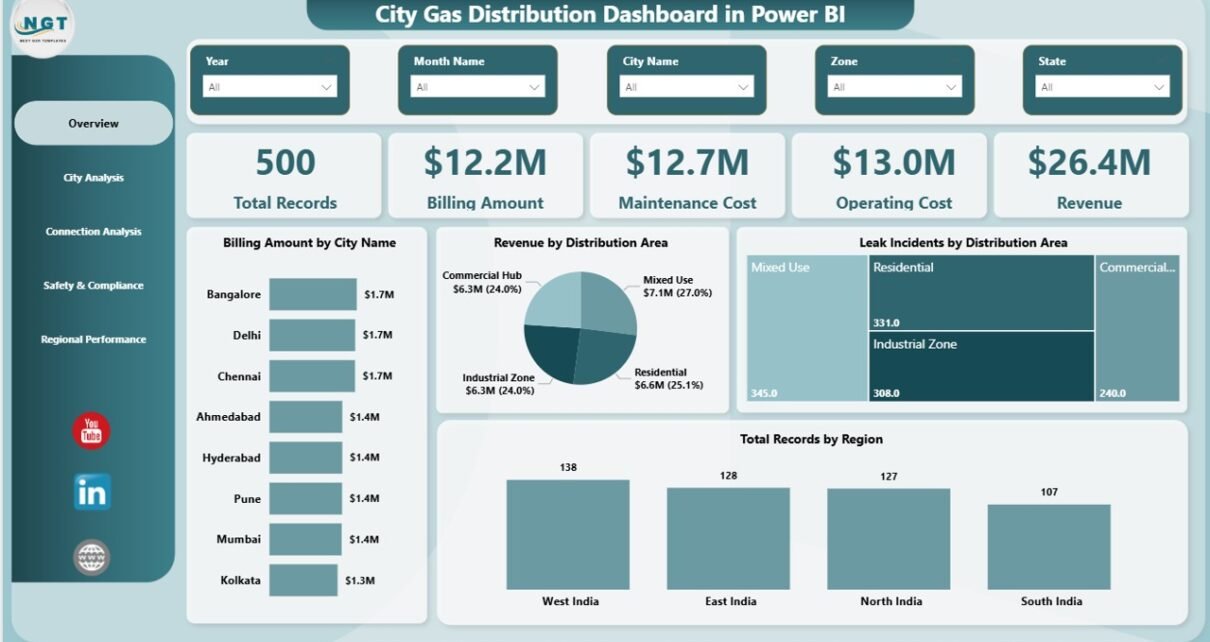
City Gas Distribution Dashboard in Power BI

March 23, 2026March 26, 2026 PKComments Off on City Gas Distribution Dashboard in Power BI
In today’s rapidly growing urban landscape, city gas distribution companies manage massive volumes of operational, financial, and safety data every single day. However, handling this data manually often leads to
Read More
Dashboard

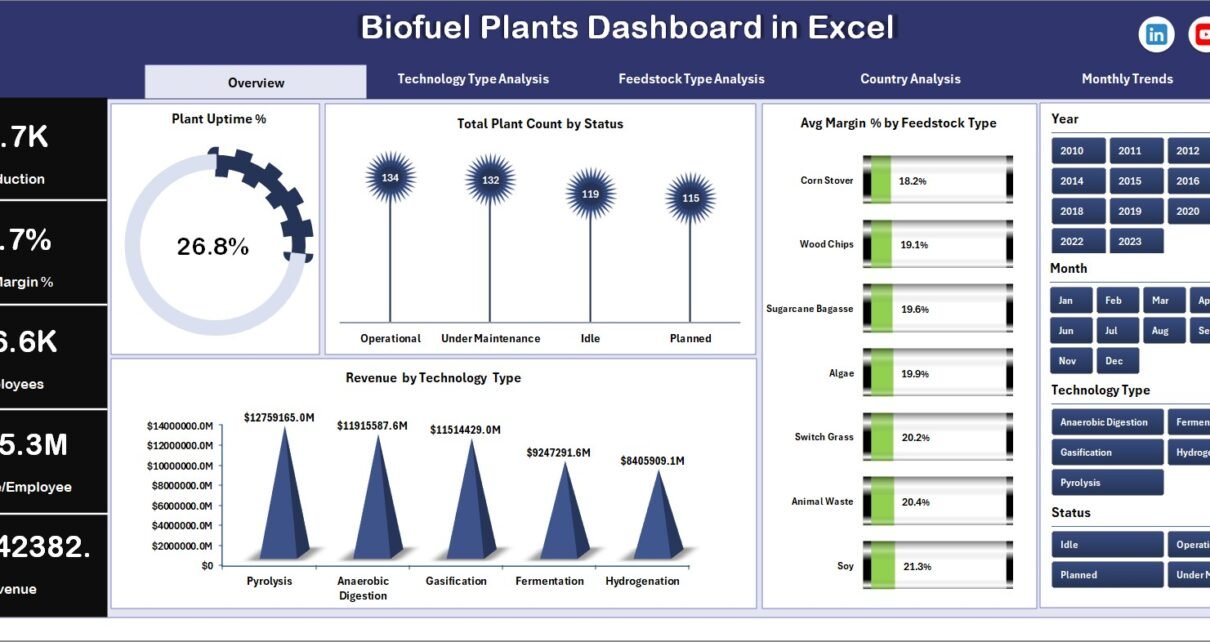
Biofuel Plants Dashboard in Excel

March 18, 2026March 18, 2026 PKComments Off on Biofuel Plants Dashboard in Excel
In today’s fast-growing renewable energy sector, biofuel plants generate massive amounts of operational, financial, and performance data. However, many organizations still struggle to manage this data effectively. As a result,
Read More
Dashboard Power BI

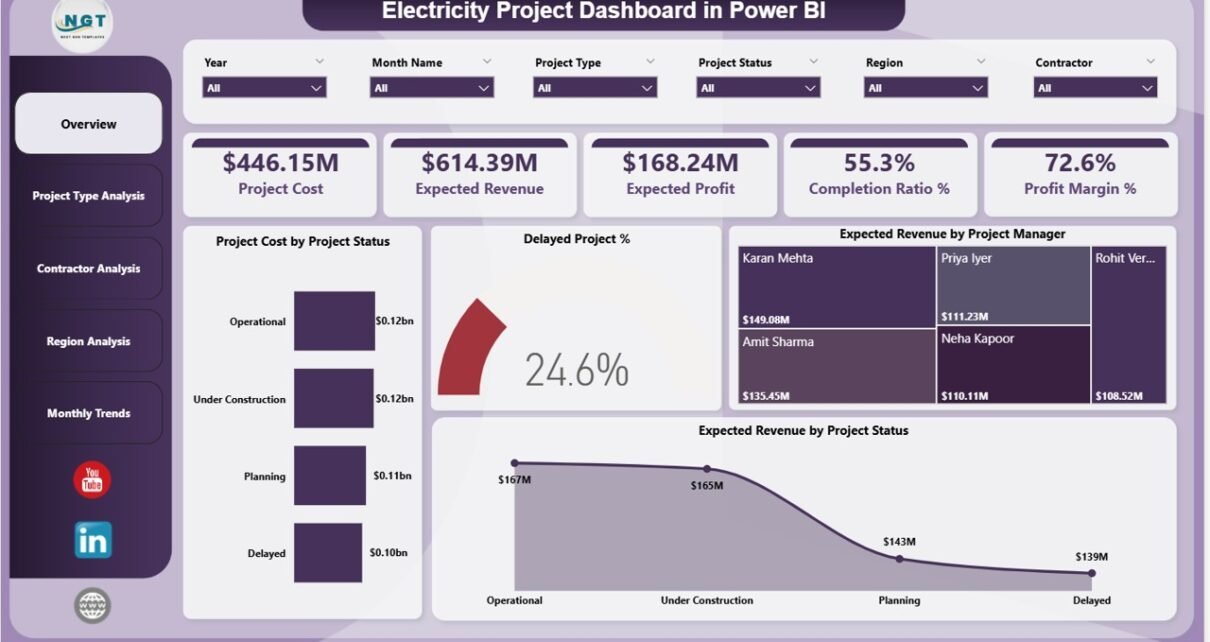
Electricity Project Dashboard in Power BI

March 10, 2026March 10, 2026 PKComments Off on Electricity Project Dashboard in Power BI
Electricity projects require huge investments, complex planning, and strong coordination among engineers, contractors, project managers, and stakeholders. Power generation plants, transmission projects, renewable installations, and infrastructure upgrades often involve multiple
Read More
Dashboard

Electricity Contract Dashboard in Excel

March 9, 2026March 9, 2026 PKComments Off on Electricity Contract Dashboard in Excel
Electricity contracts play a critical role in the energy industry. Utilities, energy providers, and power trading companies manage hundreds or even thousands of contracts with businesses, industries, and public sector
Read More
Dashboard Power BI

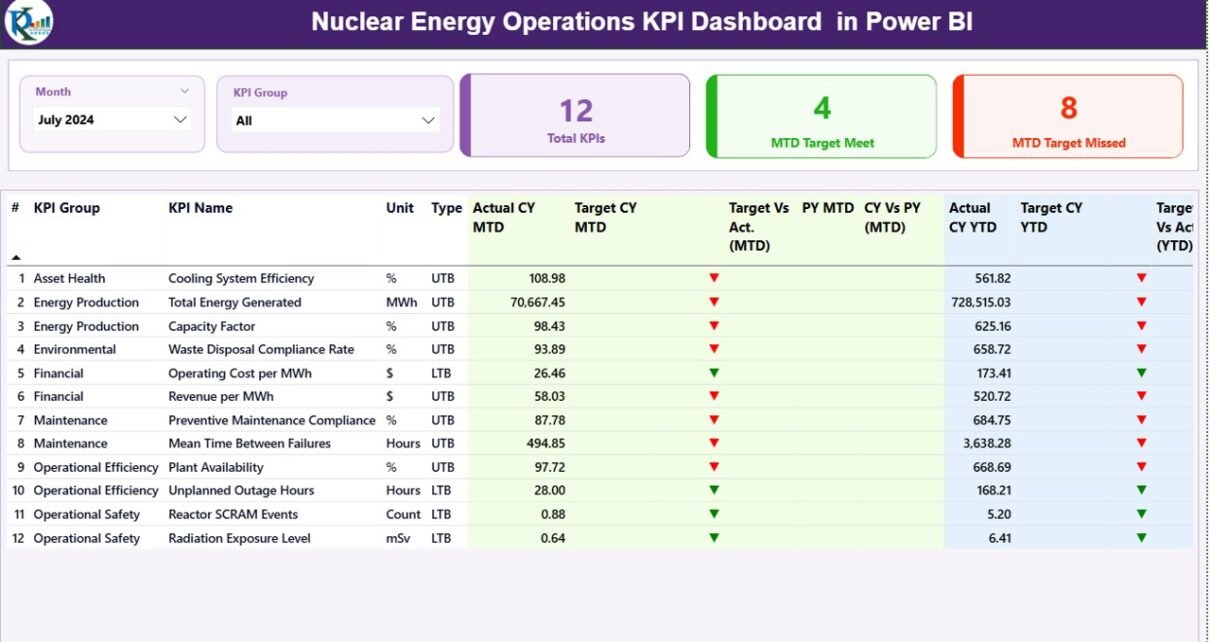
Nuclear Energy Operations KPI Dashboard in Power BI

March 3, 2026March 3, 2026 PKComments Off on Nuclear Energy Operations KPI Dashboard in Power BI
Managing nuclear energy operations requires precision, discipline, and continuous monitoring. Every decision impacts safety, regulatory compliance, plant efficiency, and financial stability. Therefore, organizations must track performance indicators in a structured
Read More
Dashboard

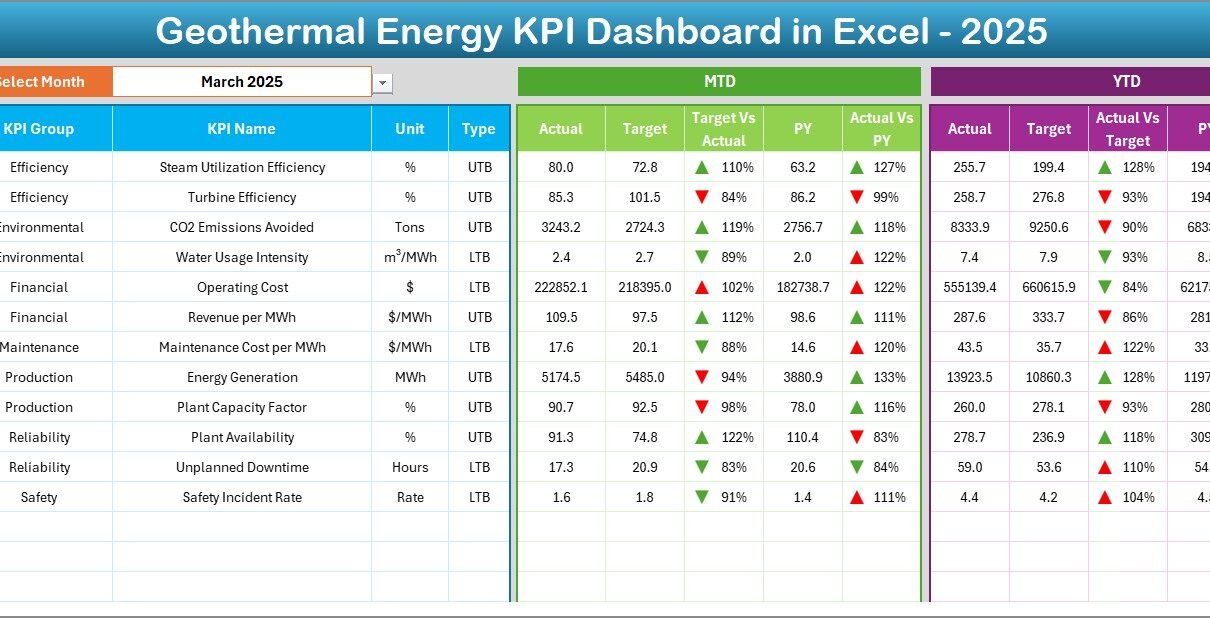
Geothermal Energy KPI Dashboard in Excel

March 2, 2026March 2, 2026 PKComments Off on Geothermal Energy KPI Dashboard in Excel
The renewable energy industry continues to expand rapidly. Among all clean energy sources, geothermal energy stands out because it provides stable, continuous, and environmentally friendly power generation. However, managing geothermal
Read More
Dashboard

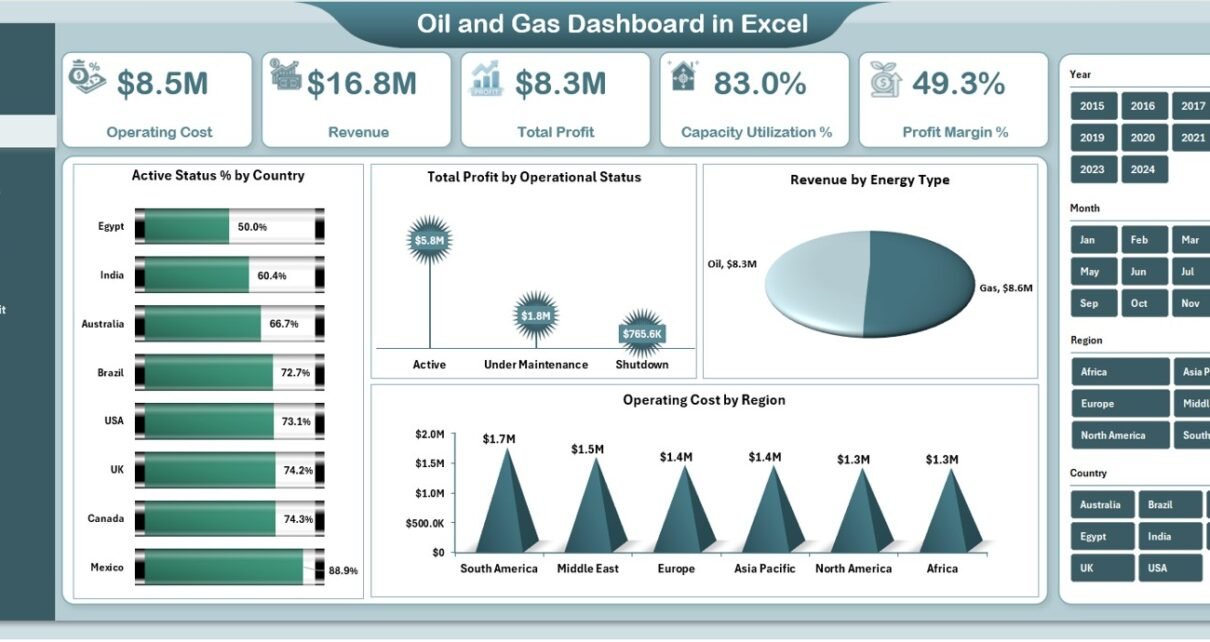
Oil and Gas Dashboard in Excel

January 15, 2026January 15, 2026 PKComments Off on Oil and Gas Dashboard in Excel
The oil and gas industry operates in one of the most complex and capital-intensive environments in the world. Every day, organizations deal with fluctuating energy prices, high operating costs, production
Read More
Dashboard Power BI

Refinery Dashboard in Power BI

January 3, 2026January 3, 2026 PKComments Off on Refinery Dashboard in Power BI
Managing a refinery involves thousands of daily decisions. Leaders must control costs, reduce downtime, optimize energy usage, and increase output at the same time. However, when teams rely on scattered
Read More

Posts pagination

1 2 3 Next
  • Learn Excel (Free Course)
    • 1. Shortcut Keys
    • 2. Fill & Flash Fill
    • 3. Find & Replace
    • 4. Sort & Filter
    • 5. Formulas & Functions
    • 6. Data Validation
    • 7. Conditional Formatting
    • 8. Basic Charts
    • 9. Advanced Charts
    • 10. Pivot Tables
    • 11. Excel Dashboards
    • 12. VBA Course
    • 13. Excel Formulas with AI
  • Templates
  • Tutorials
    • Charts and Visualization
    • VBA
    • Excel Tips and Tricks
    • Excel Dashboards
    • Power Pivot & DAX
  • Power BI
  • Template Store
    • Ready to Use Templates
  • Courses
  • Academy
    • Excel + AI Mastery: 100 Formulas
    • Excel Pivot Tables & Dashboards
  • About Us
  • Contact Us
Copyright © 2023 PK-AnExcelExpert.com - Privacy Policy