New: NextGenTemplates Academy - video courses on Excel formulas with AI and Pivot Tables & dashboards. Early-bird: 20% off with code EARLYBIRD20 - first 20 orders only. See the courses →
  • Learn Excel (Free Course)
    • 1. Shortcut Keys
    • 2. Fill & Flash Fill
    • 3. Find & Replace
    • 4. Sort & Filter
    • 5. Formulas & Functions
    • 6. Data Validation
    • 7. Conditional Formatting
    • 8. Basic Charts
    • 9. Advanced Charts
    • 10. Pivot Tables
    • 11. Excel Dashboards
    • 12. VBA Course
    • 13. Excel Formulas with AI
  • Templates
  • Tutorials
    • Charts and Visualization
    • VBA
    • Excel Tips and Tricks
    • Excel Dashboards
    • Power Pivot & DAX
  • Power BI
  • Template Store
    • Ready to Use Templates
  • Courses
  • Academy
    • Excel + AI Mastery: 100 Formulas
    • Excel Pivot Tables & Dashboards
  • About Us
  • Contact Us

PK: An Excel Expert

Transforming Data into Decisions

Tag: Excel data

Dashboard Power BI

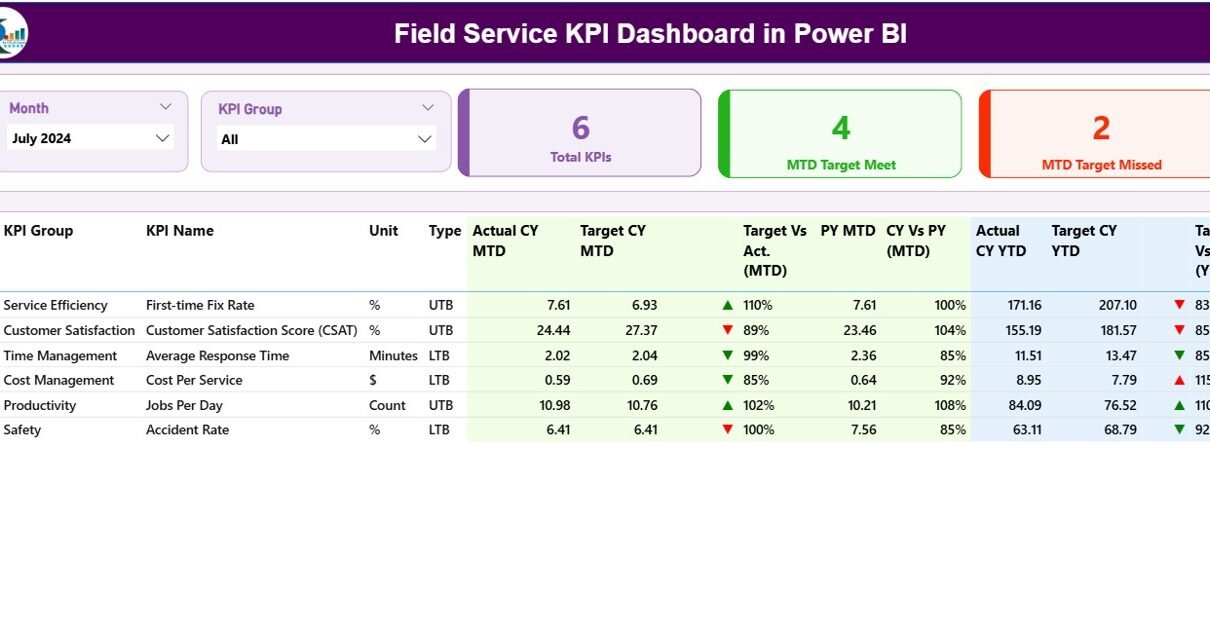
Field Service KPI Dashboard in Power BI

October 15, 2025October 15, 2025 PKComments Off on Field Service KPI Dashboard in Power BI
In today’s competitive service-driven environment, organizations must ensure that their field operations run efficiently and effectively. Managing field teams, tracking service requests, and ensuring customer satisfaction can be challenging without
Read More
Dashboard Power BI

Compliance Tracking Dashboard in Power BI

July 5, 2025July 5, 2025 PKComments Off on Compliance Tracking Dashboard in Power BI
In today’s fast-paced business environment, staying compliant is not just a legal requirement—it's a competitive advantage. Organizations across industries must track hundreds of regulations, internal policies, and risk controls. Yet,
Read More
Power BI

Hydropower KPI Dashboard in Power BI

May 15, 2025May 15, 2025 PKComments Off on Hydropower KPI Dashboard in Power BI
In the era of clean and renewable energy, hydropower plays a pivotal role in ensuring sustainable electricity generation. But how can power plant managers and energy analysts effectively monitor performance,
Read More
Power BI

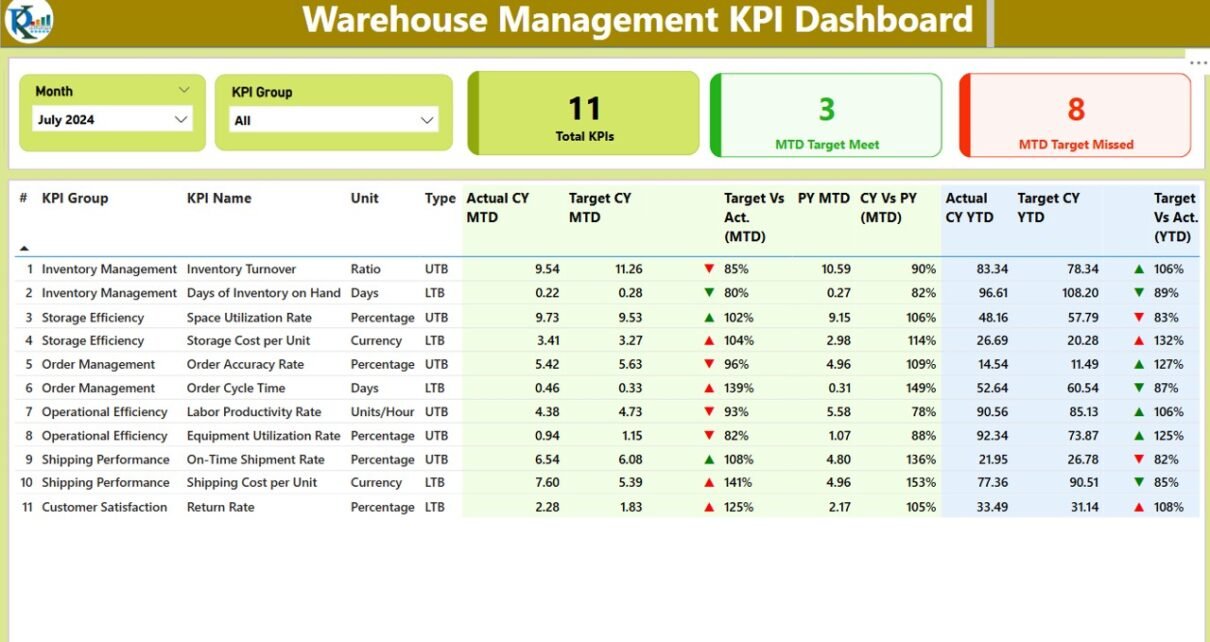
Warehouse Management KPI Dashboard in Power BI

February 11, 2025March 20, 2025 PKComments Off on Warehouse Management KPI Dashboard in Power BI
Warehouse management is a crucial part of any supply chain, ensuring seamless inventory tracking, optimizing storage, and improving operational efficiency. But how do businesses measure and improve warehouse performance? The
Read More
Power BI

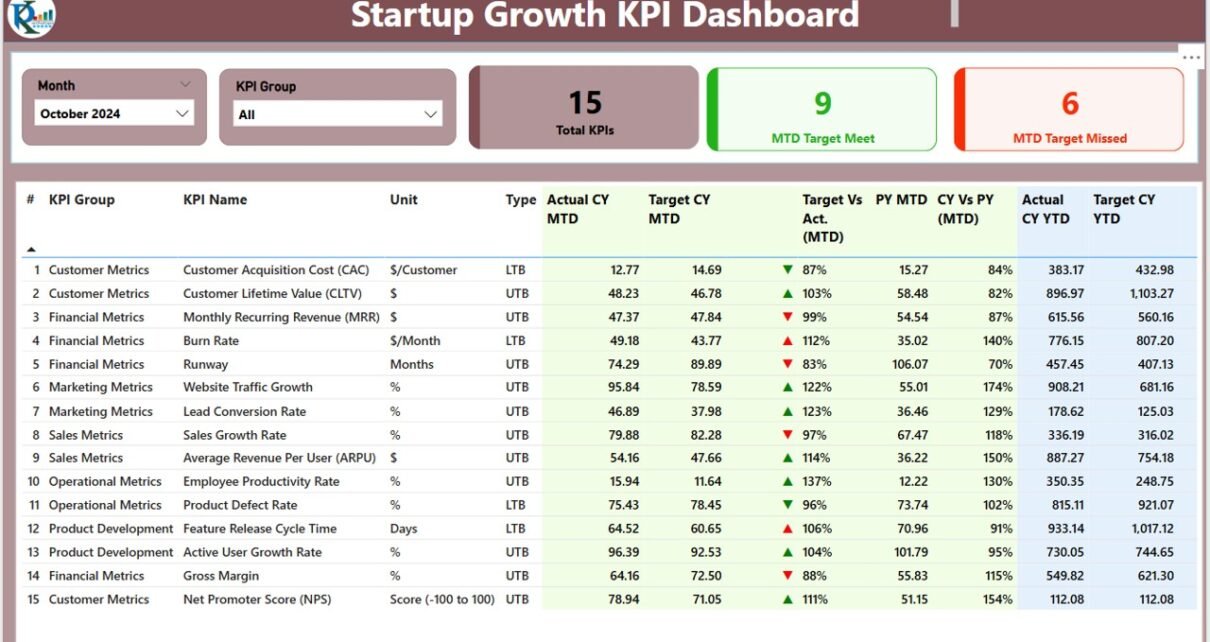
Startup Growth KPI Dashboard in Power BI

February 8, 2025March 20, 2025 PKComments Off on Startup Growth KPI Dashboard in Power BI
Startups need clear insights into their growth metrics to make data-driven decisions. A Startup Growth KPI Dashboard in Power BI helps businesses track their performance by analyzing key metrics like
Read More
Power BI

Freelance Business KPI Dashboard in Power BI

February 7, 2025March 22, 2025 PKComments Off on Freelance Business KPI Dashboard in Power BI
Freelancers need an efficient way to track their performance, income, and business growth. This is where a Freelance Business KPI Dashboard in Power BI becomes invaluable. It allows freelancers to
Read More
Power BI

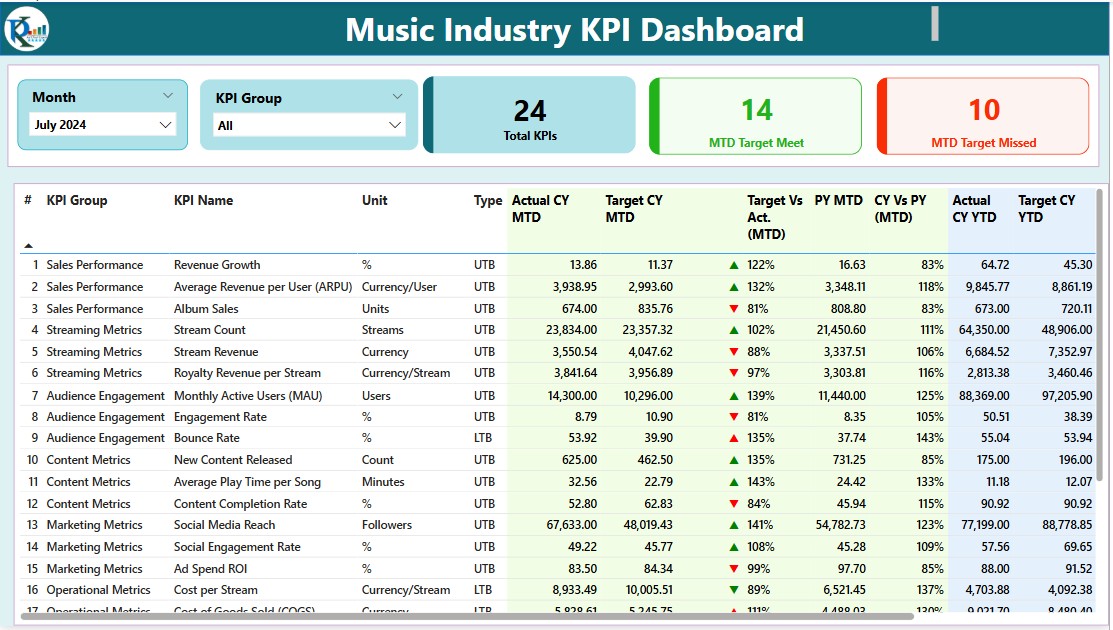
Music Industry KPI Dashboard in Power BI

January 31, 2025April 2, 2025 PKComments Off on Music Industry KPI Dashboard in Power BI
In today’s fast-paced digital world, the music industry is constantly evolving. With the rise of streaming platforms, social media engagement, and digital sales, keeping track of Key Performance Indicators (KPIs)
Read More
Power BI

Advertising KPI Dashboard in Power BI

December 27, 2024April 10, 2025 PKComments Off on Advertising KPI Dashboard in Power BI
In the dynamic realm of advertising, data-driven decision-making is pivotal. The Advertising KPI Dashboard in Power BI offers a comprehensive, ready-to-use solution to harness the power of data stored in
Read More
Power BI

Project Management KPI Dashboard in Power BI

December 6, 2024March 3, 2025 PKComments Off on Project Management KPI Dashboard in Power BI
Managing projects efficiently requires a clear understanding of key performance indicators (KPIs). A Project Management KPI Dashboard in Power BI is an essential tool that allows project managers to visualize
Read More
Power BI

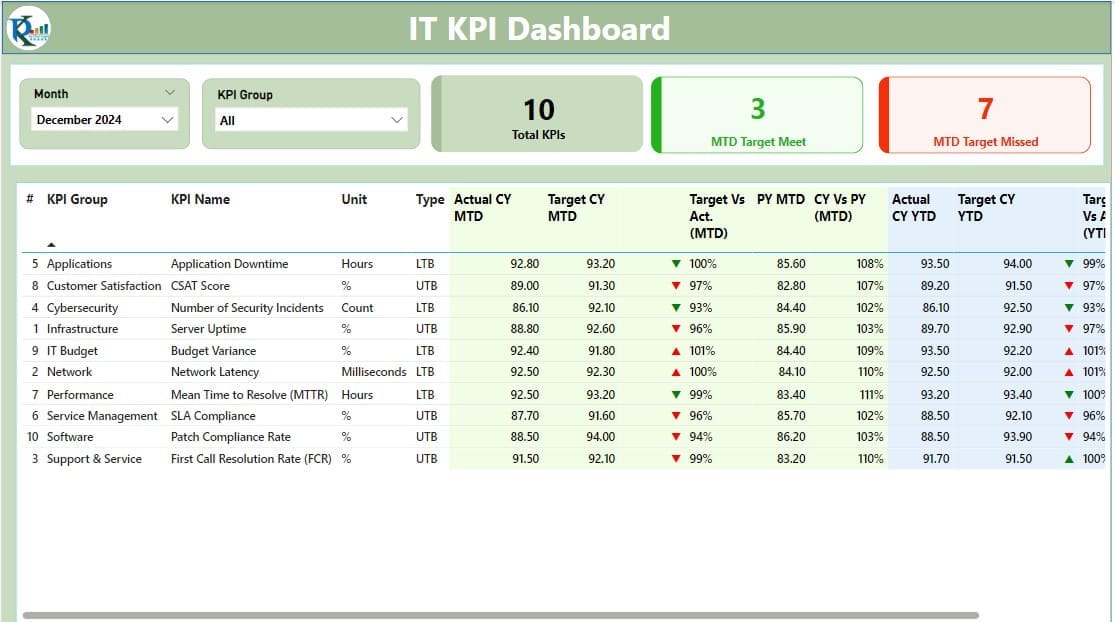
IT KPI Dashboard in Power BI

December 3, 2024March 2, 2025 PKComments Off on IT KPI Dashboard in Power BI
Tracking Key Performance Indicators (KPIs) is essential for any IT team aiming to achieve its goals efficiently. Using Power BI, you can create an IT KPI Dashboard that helps monitor
Read More
  • Learn Excel (Free Course)
    • 1. Shortcut Keys
    • 2. Fill & Flash Fill
    • 3. Find & Replace
    • 4. Sort & Filter
    • 5. Formulas & Functions
    • 6. Data Validation
    • 7. Conditional Formatting
    • 8. Basic Charts
    • 9. Advanced Charts
    • 10. Pivot Tables
    • 11. Excel Dashboards
    • 12. VBA Course
    • 13. Excel Formulas with AI
  • Templates
  • Tutorials
    • Charts and Visualization
    • VBA
    • Excel Tips and Tricks
    • Excel Dashboards
    • Power Pivot & DAX
  • Power BI
  • Template Store
    • Ready to Use Templates
  • Courses
  • Academy
    • Excel + AI Mastery: 100 Formulas
    • Excel Pivot Tables & Dashboards
  • About Us
  • Contact Us
Copyright © 2023 PK-AnExcelExpert.com - Privacy Policy