New: NextGenTemplates Academy - video courses on Excel formulas with AI and Pivot Tables & dashboards. Early-bird: 20% off with code EARLYBIRD20 - first 20 orders only. See the courses →
  • Learn Excel (Free Course)
    • 1. Shortcut Keys
    • 2. Fill & Flash Fill
    • 3. Find & Replace
    • 4. Sort & Filter
    • 5. Formulas & Functions
    • 6. Data Validation
    • 7. Conditional Formatting
    • 8. Basic Charts
    • 9. Advanced Charts
    • 10. Pivot Tables
    • 11. Excel Dashboards
    • 12. VBA Course
    • 13. Excel Formulas with AI
  • Templates
  • Tutorials
    • Charts and Visualization
    • VBA
    • Excel Tips and Tricks
    • Excel Dashboards
    • Power Pivot & DAX
  • Power BI
  • Template Store
    • Ready to Use Templates
  • Courses
  • Academy
    • Excel + AI Mastery: 100 Formulas
    • Excel Pivot Tables & Dashboards
  • About Us
  • Contact Us

PK: An Excel Expert

Transforming Data into Decisions

Tag: Excel KPI Dashboard

Dashboard

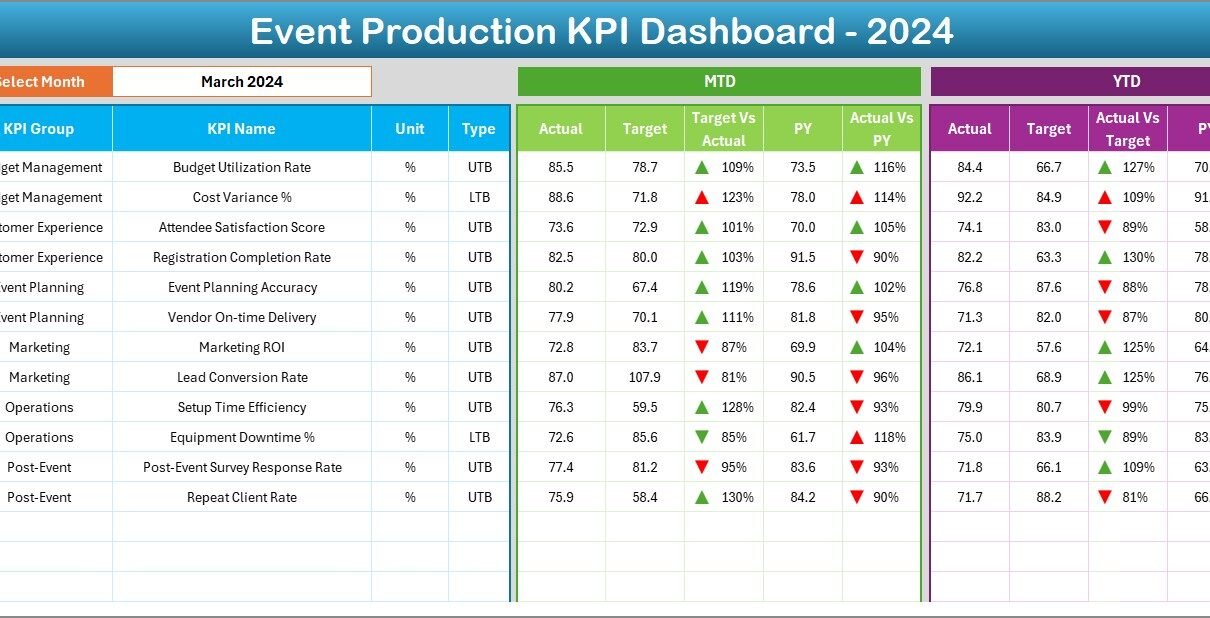
Event Production KPI Dashboard in Excel

October 28, 2025October 28, 2025 PKComments Off on Event Production KPI Dashboard in Excel
Event management is one of the most dynamic industries, where success depends on efficient coordination, timely execution, and accurate performance tracking. From planning and budgeting to logistics and post-event evaluation,
Read More
Templates

Corporate Audit Dashboard in Excel

October 27, 2025October 27, 2025 PKComments Off on Corporate Audit Dashboard in Excel
In today’s business world, auditing plays a vital role in maintaining accountability, transparency, and compliance. Whether it’s an internal review or an external inspection, organizations must ensure that their financial
Read More
Templates

Consulting KPI Dashboard in Excel

October 25, 2025October 10, 2026 PKComments Off on Consulting KPI Dashboard in Excel
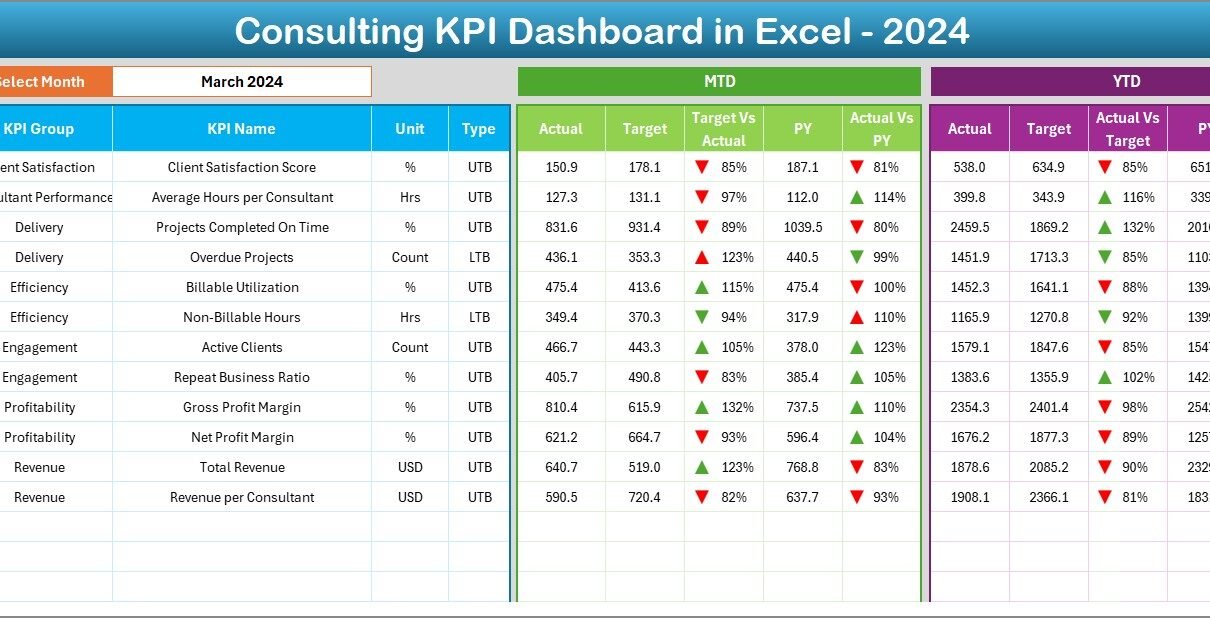
In today’s consulting industry, information moves fast and clients expect measurable results. Successful consulting firms rely on Key Performance Indicators (KPIs) to track performance, manage efficiency, and improve client satisfaction.
Read More
Templates

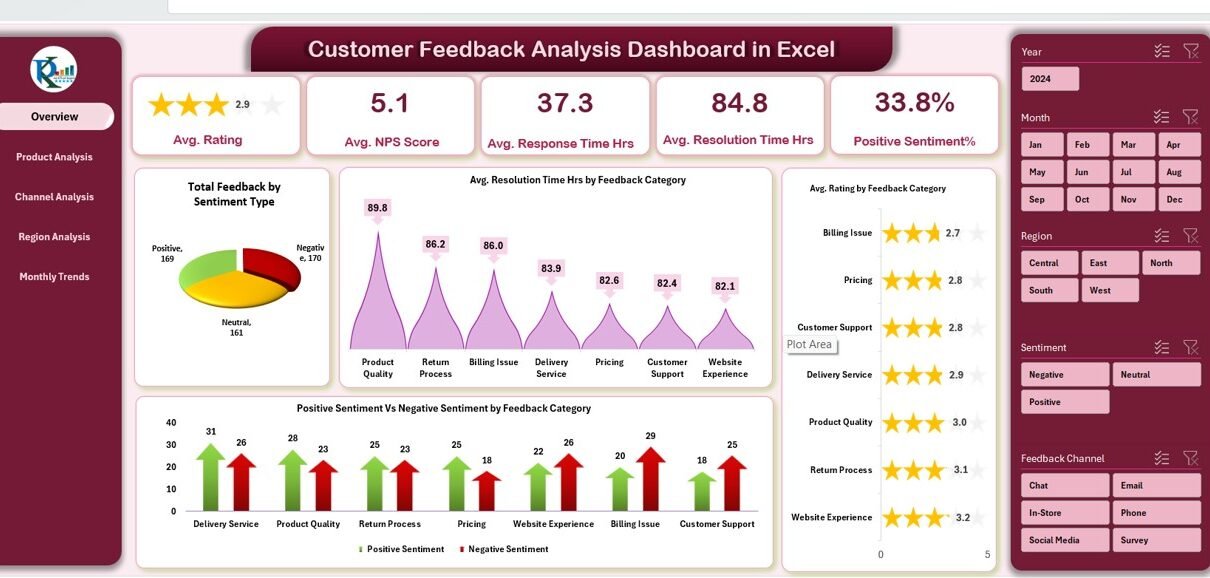
Customer Feedback Analysis Dashboard in Excel

October 24, 2025October 24, 2025 PKComments Off on Customer Feedback Analysis Dashboard in Excel
Understanding what customers think about your product or service is the foundation of every successful business. Feedback helps you identify strengths, address weaknesses, and continuously improve customer satisfaction. However, when
Read More
Dashboard

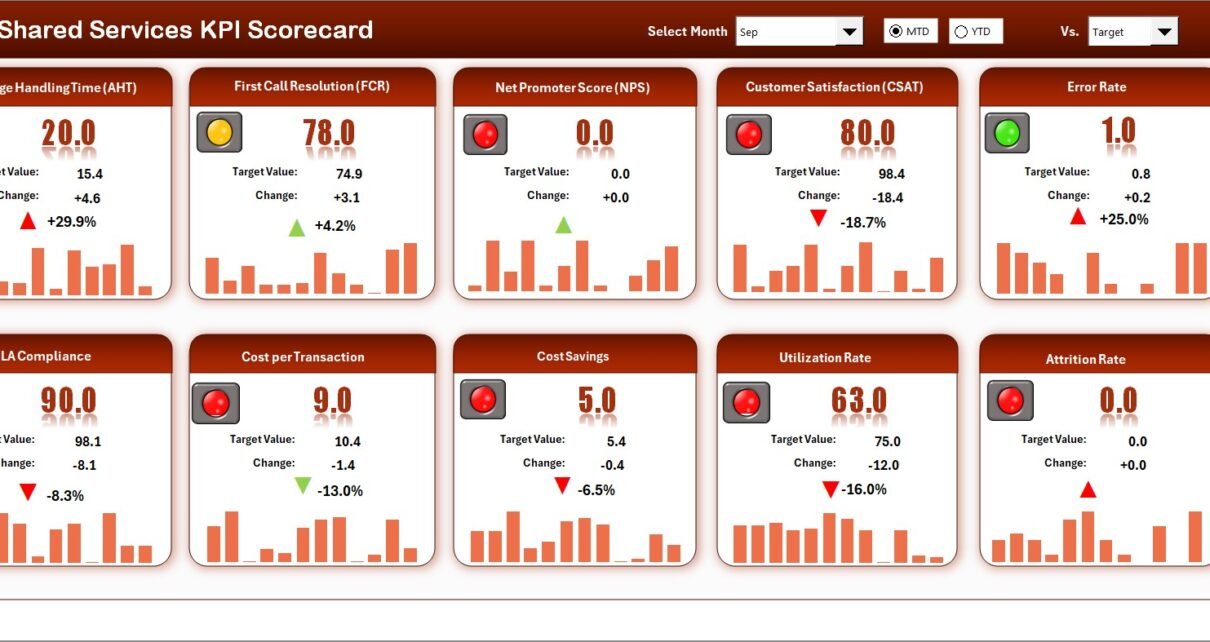
Shared Services KPI Scorecard in Excel

October 24, 2025October 24, 2025 PKComments Off on Shared Services KPI Scorecard in Excel
In today’s business landscape, shared services play a vital role in delivering consistent support across finance, HR, IT, procurement, and operations. However, managing performance across multiple service functions can quickly
Read More
Templates

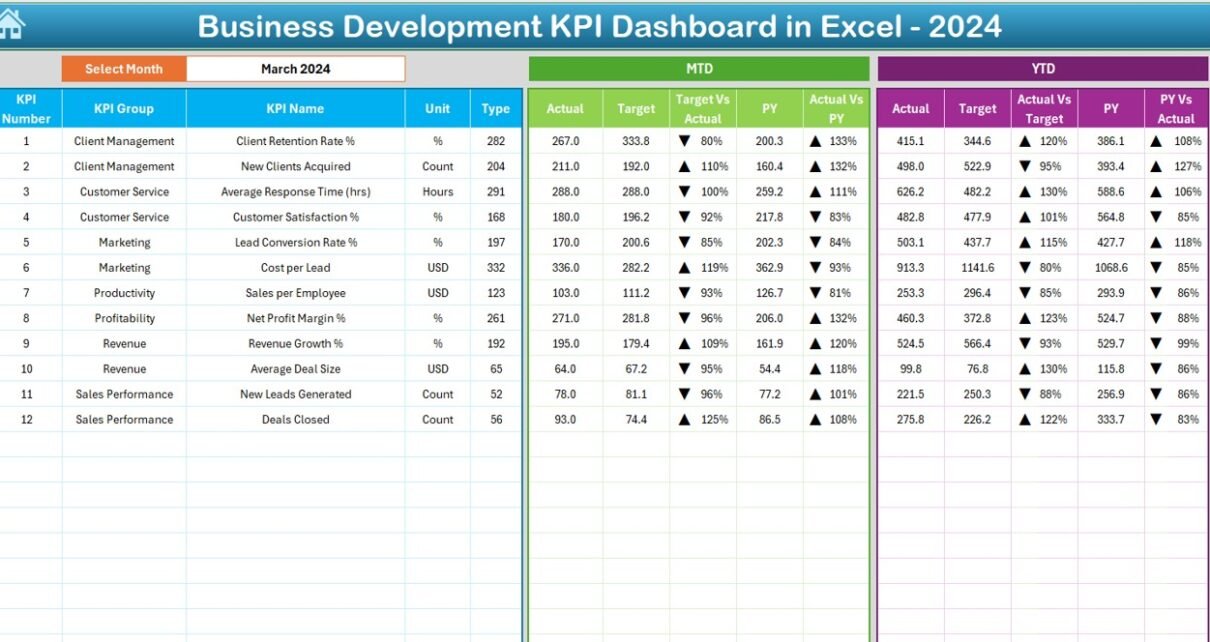
Business Development KPI Dashboard in Excel

October 24, 2025October 24, 2025 PKComments Off on Business Development KPI Dashboard in Excel
In today’s competitive market, every organization needs to track its business development activities effectively. Managing sales leads, monitoring conversions, evaluating team performance, and analyzing growth trends are essential for sustainable
Read More
Dashboard

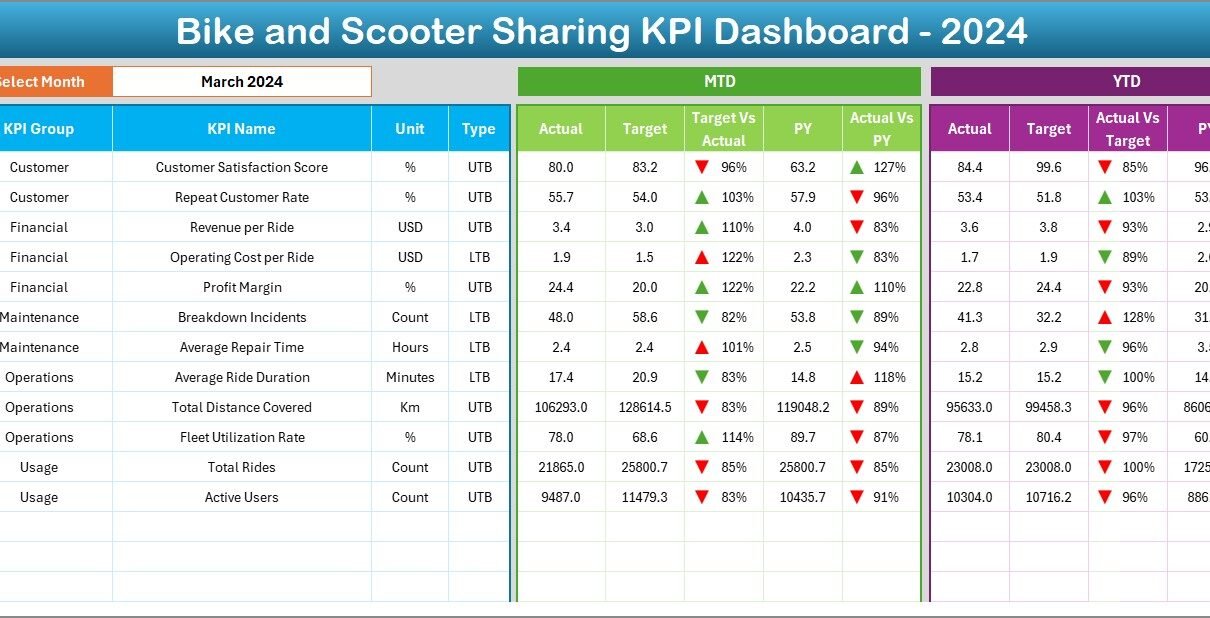
Bike and Scooter Sharing KPI Dashboard in Excel

October 24, 2025October 24, 2025 PKComments Off on Bike and Scooter Sharing KPI Dashboard in Excel
In today’s fast-growing urban mobility market, bike and scooter sharing services have become a vital part of modern transportation. With thousands of users, multiple docking stations, and daily rental transactions,
Read More
Templates

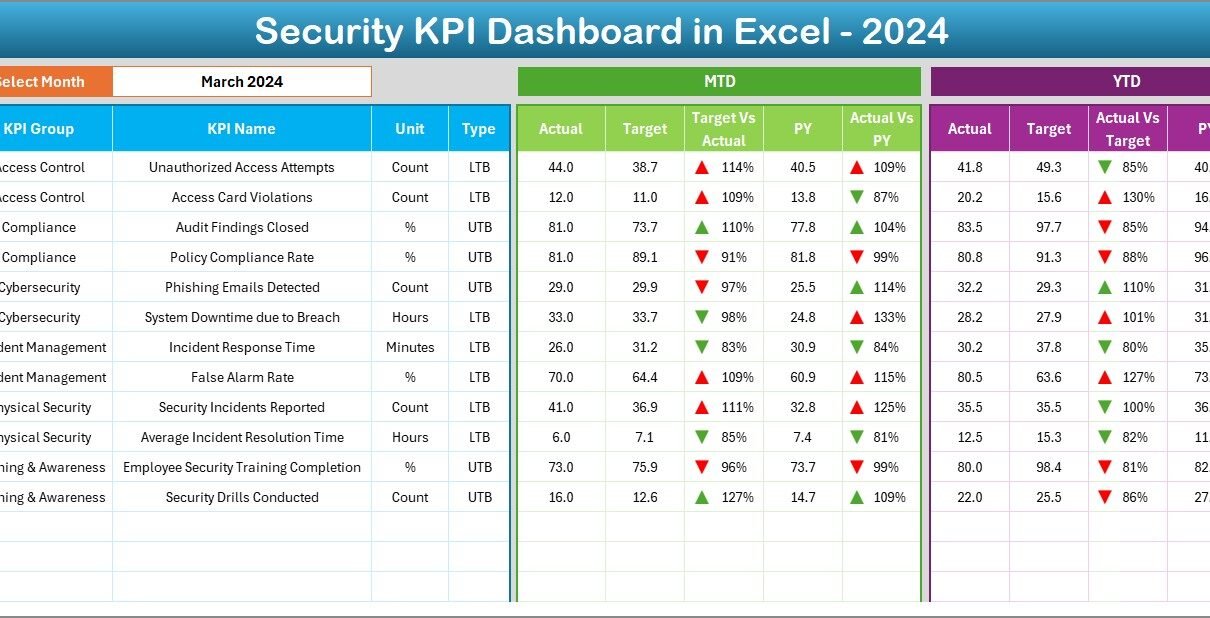
Security KPI Dashboard in Excel

October 18, 2025October 18, 2025 PKComments Off on Security KPI Dashboard in Excel
In today’s digital world, data and infrastructure security stand as top priorities for every organization. Whether it’s a small business or a global enterprise, maintaining strong cybersecurity and physical protection
Read More
Templates

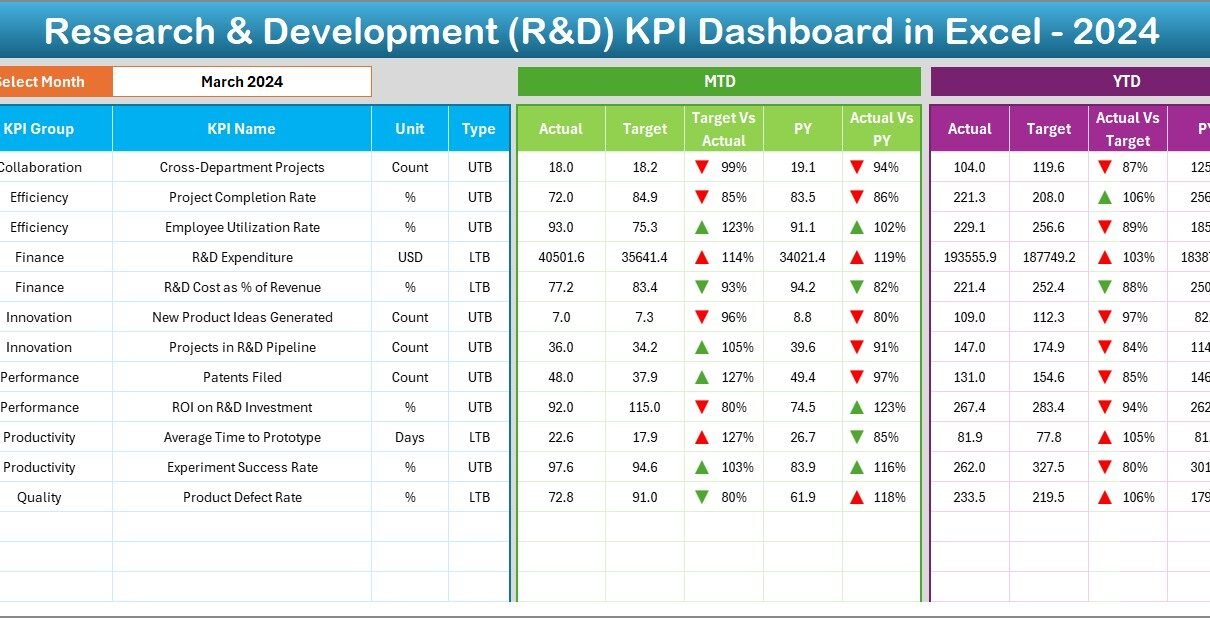
Research & Development (R&D) KPI Dashboard in Excel

October 17, 2025October 17, 2025 PKComments Off on Research & Development (R&D) KPI Dashboard in Excel
In today’s fast-moving business world, innovation drives growth. Companies that invest in Research and Development (R&D) constantly look for ways to track, analyze, and optimize their innovation performance. However, managing
Read More
Dashboard

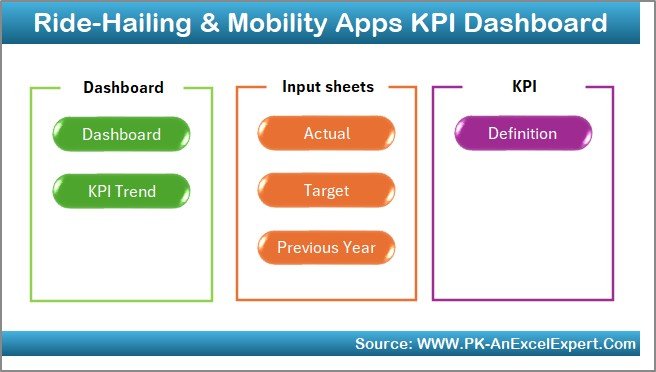
Ride-Hailing & Mobility Apps KPI Dashboard in Excel

October 17, 2025October 17, 2025 PKComments Off on Ride-Hailing & Mobility Apps KPI Dashboard in Excel
The ride-hailing and mobility industry is one of the fastest-growing sectors in the world. Ride-Hailing & Mobility Apps KPI Dashboard in ExcelFrom on-demand taxis to micro-mobility platforms and delivery fleets,
Read More

Posts pagination

Previous 1 … 35 36 37 … 44 Next
  • Learn Excel (Free Course)
    • 1. Shortcut Keys
    • 2. Fill & Flash Fill
    • 3. Find & Replace
    • 4. Sort & Filter
    • 5. Formulas & Functions
    • 6. Data Validation
    • 7. Conditional Formatting
    • 8. Basic Charts
    • 9. Advanced Charts
    • 10. Pivot Tables
    • 11. Excel Dashboards
    • 12. VBA Course
    • 13. Excel Formulas with AI
  • Templates
  • Tutorials
    • Charts and Visualization
    • VBA
    • Excel Tips and Tricks
    • Excel Dashboards
    • Power Pivot & DAX
  • Power BI
  • Template Store
    • Ready to Use Templates
  • Courses
  • Academy
    • Excel + AI Mastery: 100 Formulas
    • Excel Pivot Tables & Dashboards
  • About Us
  • Contact Us
Copyright © 2023 PK-AnExcelExpert.com - Privacy Policy