New: NextGenTemplates Academy - video courses on Excel formulas with AI and Pivot Tables & dashboards. Early-bird: 20% off with code EARLYBIRD20 - first 20 orders only. See the courses →
  • Learn Excel (Free Course)
    • 1. Shortcut Keys
    • 2. Fill & Flash Fill
    • 3. Find & Replace
    • 4. Sort & Filter
    • 5. Formulas & Functions
    • 6. Data Validation
    • 7. Conditional Formatting
    • 8. Basic Charts
    • 9. Advanced Charts
    • 10. Pivot Tables
    • 11. Excel Dashboards
    • 12. VBA Course
    • 13. Excel Formulas with AI
  • Templates
  • Tutorials
    • Charts and Visualization
    • VBA
    • Excel Tips and Tricks
    • Excel Dashboards
    • Power Pivot & DAX
  • Power BI
  • Template Store
    • Ready to Use Templates
  • Courses
  • Academy
    • Excel + AI Mastery: 100 Formulas
    • Excel Pivot Tables & Dashboards
  • About Us
  • Contact Us

PK: An Excel Expert

Transforming Data into Decisions

Tag: Excel Reporting Dashboard

Dashboard

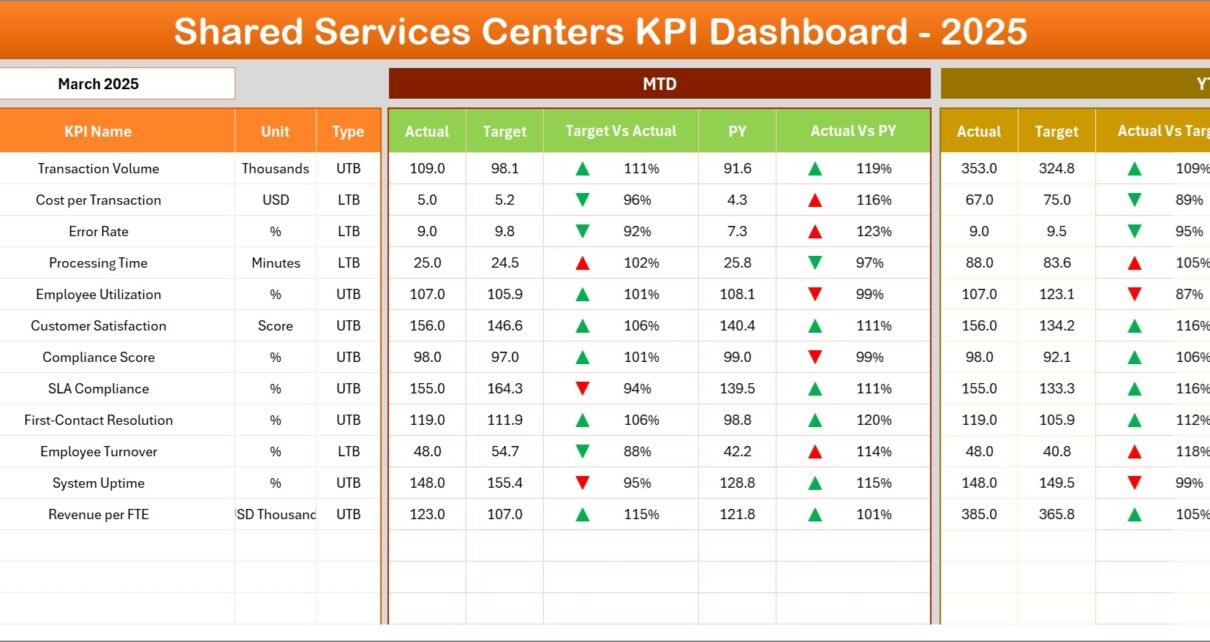
Shared Services Centers KPI Dashboard in Excel

March 10, 2026March 10, 2026 PKComments Off on Shared Services Centers KPI Dashboard in Excel
Shared Services Centers (SSC) play a critical role in modern organizations. Companies centralize functions such as finance, HR, procurement, IT services, payroll, and customer support into shared service centers to
Read More
Dashboard

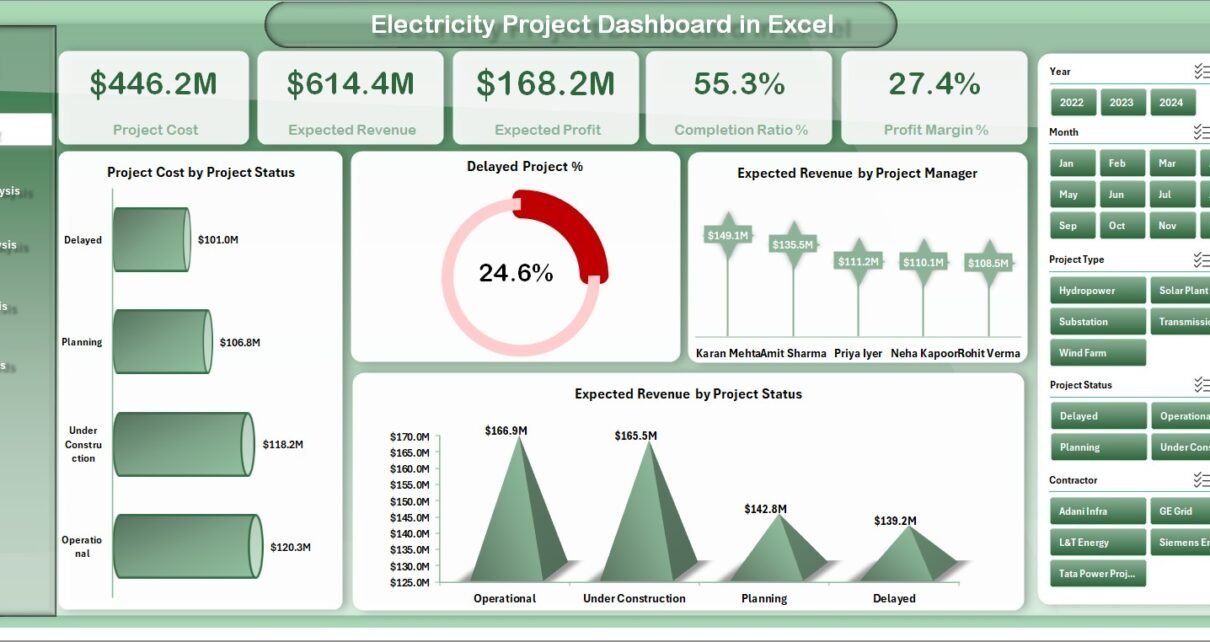
Electricity Project Dashboard in Excel

March 10, 2026March 10, 2026 PKComments Off on Electricity Project Dashboard in Excel
Electricity infrastructure projects require large investments, strict timelines, and continuous monitoring. Power plants, grid expansion projects, substations, and renewable energy installations involve multiple contractors, regions, and project managers. Therefore, organizations
Read More
Dashboard

Electricity Contract Dashboard in Excel

March 9, 2026March 9, 2026 PKComments Off on Electricity Contract Dashboard in Excel
Electricity contracts play a critical role in the energy industry. Utilities, energy providers, and power trading companies manage hundreds or even thousands of contracts with businesses, industries, and public sector
Read More
Dashboard

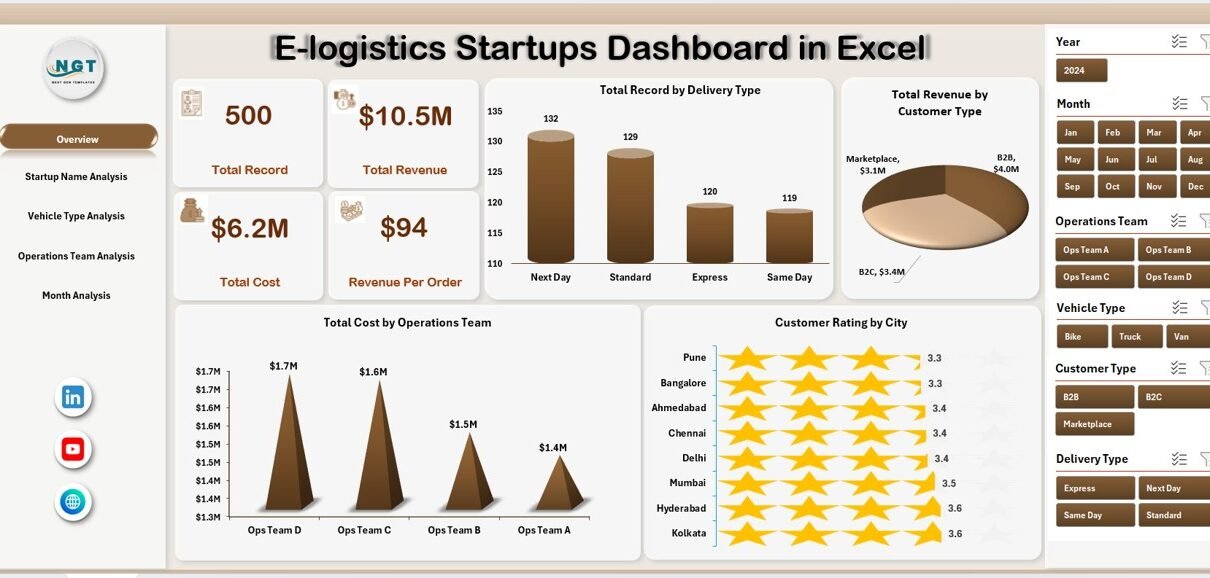
E-logistics Startups Dashboard in Excel

March 7, 2026March 7, 2026 PKComments Off on E-logistics Startups Dashboard in Excel
E-logistics startups operate in a fast-paced and highly competitive environment. Every day, they manage deliveries, track vehicle movement, monitor operational costs, and measure customer satisfaction. At the same time, they
Read More
Dashboard

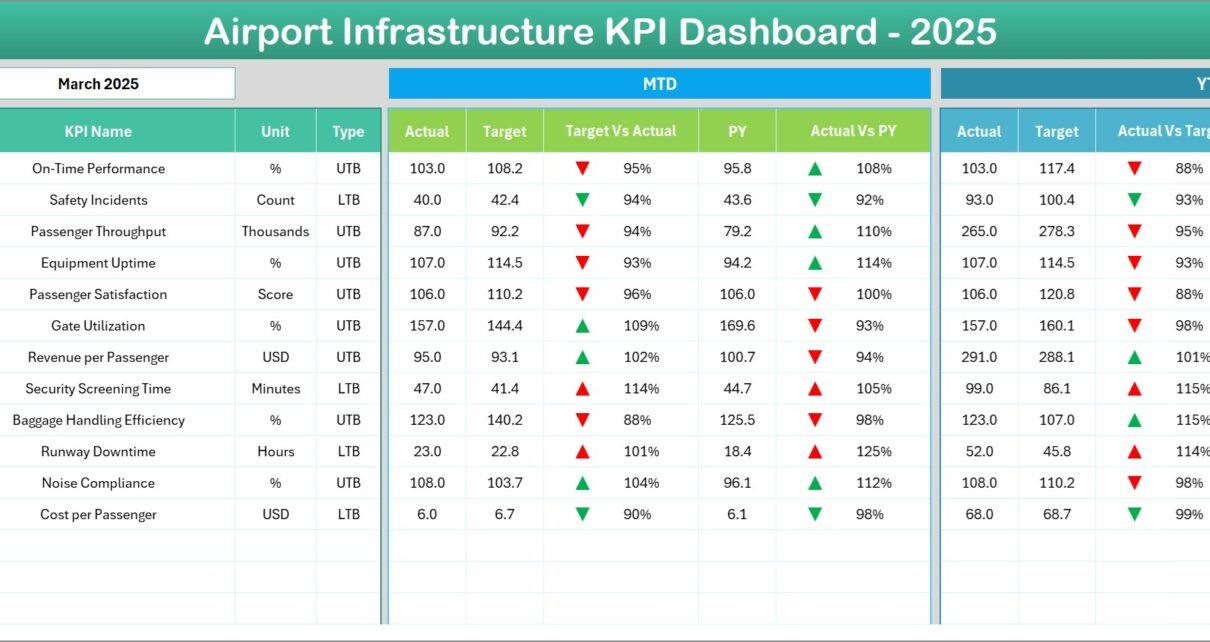
Airport Infrastructure KPI Dashboard in Excel

March 7, 2026March 7, 2026 PKComments Off on Airport Infrastructure KPI Dashboard in Excel
Airports operate as complex infrastructure hubs that connect cities, countries, and global trade routes. Every day, thousands of passengers, aircraft, and cargo shipments pass through airport facilities. Therefore, airport authorities
Read More
Dashboard

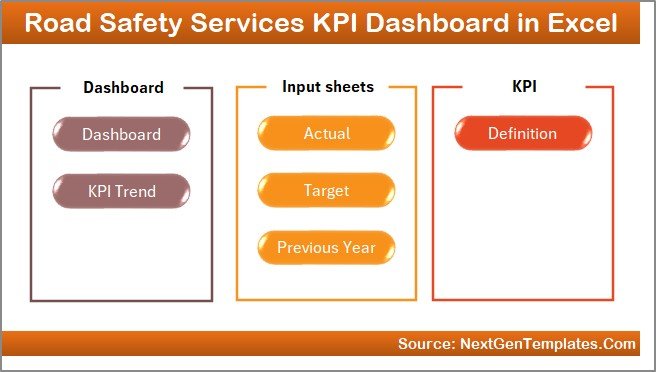
Road Safety Services KPI Dashboard in Excel

March 6, 2026March 6, 2026 PKComments Off on Road Safety Services KPI Dashboard in Excel
Road safety management plays a critical role in protecting lives, improving traffic control, and reducing accidents on roads. However, many road safety departments still manage performance data using scattered spreadsheets,
Read More
Dashboard

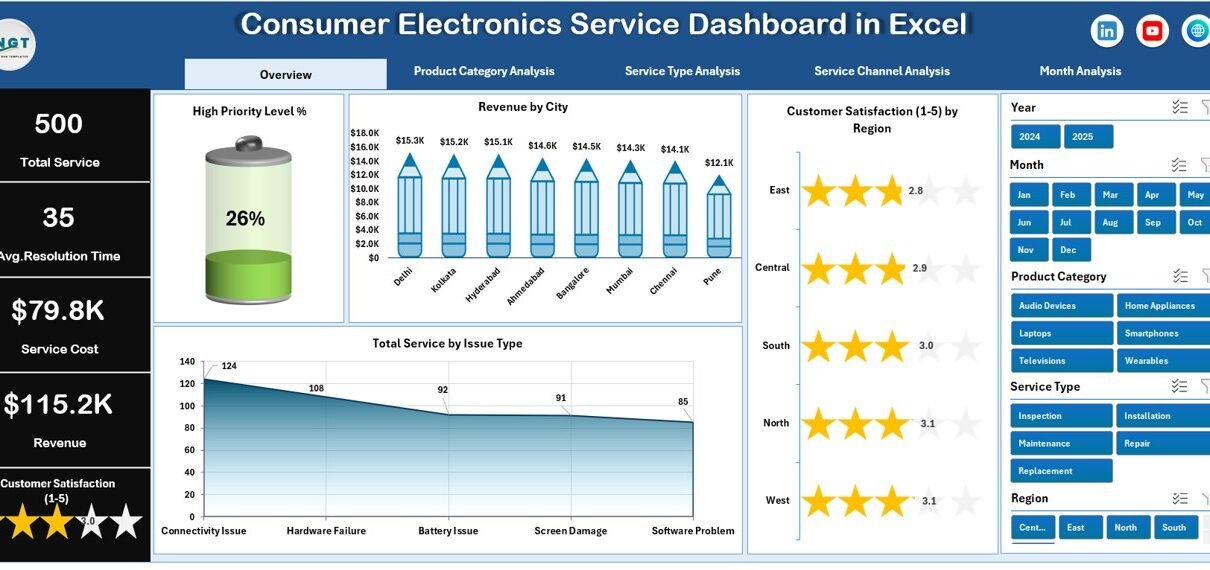
Consumer Electronics Service Dashboard in Excel

March 2, 2026March 2, 2026 PKComments Off on Consumer Electronics Service Dashboard in Excel
Consumer electronics companies handle thousands of service requests every month. Customers expect fast repairs, quick responses, and high-quality service experiences. However, managing service data manually creates confusion, delays decision-making, and
Read More
Dashboard

Commodities Trading Dashboard in Excel

February 28, 2026February 28, 2026 PKComments Off on Commodities Trading Dashboard in Excel
In today’s fast-moving financial markets, commodities trading requires speed, accuracy, and data-driven decision-making. Traders, brokers, and financial analysts continuously monitor trade values, brokerage costs, settlement status, and profit & loss
Read More
Dashboard

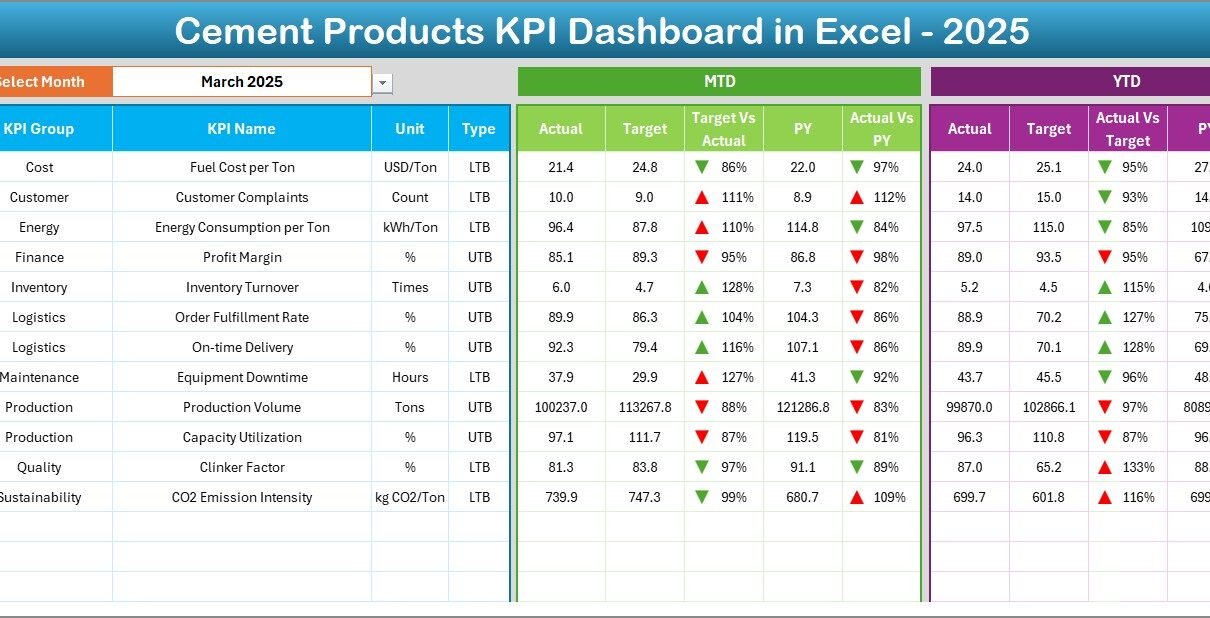
Cement Products KPI Dashboard in Excel

February 25, 2026February 25, 2026 PKComments Off on Cement Products KPI Dashboard in Excel
The cement industry operates in a highly competitive and performance-driven environment. Manufacturers must continuously monitor production efficiency, operational costs, product quality, logistics performance, and sales outcomes. However, many cement companies
Read More
Dashboard

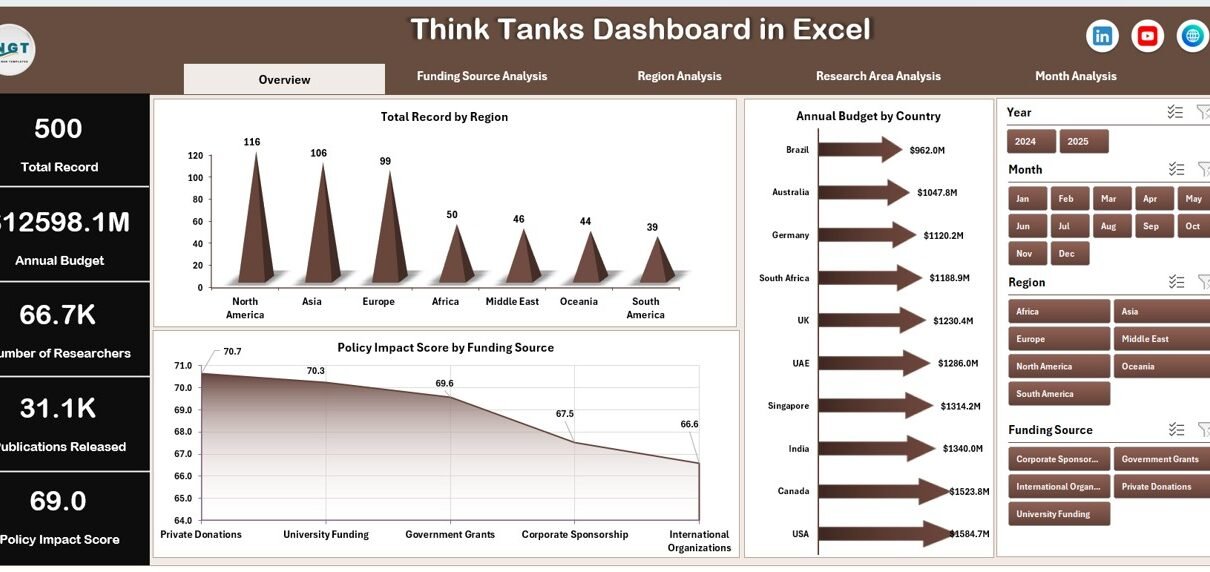
Think Tanks Dashboard in Excel

February 24, 2026February 24, 2026 PKComments Off on Think Tanks Dashboard in Excel
Think tanks play a critical role in shaping public policy, economic strategies, and social development. They conduct research, publish reports, organize events, and influence decision-making across governments, institutions, and organizations.
Read More

Posts pagination

Previous 1 2 3 4 Next
  • Learn Excel (Free Course)
    • 1. Shortcut Keys
    • 2. Fill & Flash Fill
    • 3. Find & Replace
    • 4. Sort & Filter
    • 5. Formulas & Functions
    • 6. Data Validation
    • 7. Conditional Formatting
    • 8. Basic Charts
    • 9. Advanced Charts
    • 10. Pivot Tables
    • 11. Excel Dashboards
    • 12. VBA Course
    • 13. Excel Formulas with AI
  • Templates
  • Tutorials
    • Charts and Visualization
    • VBA
    • Excel Tips and Tricks
    • Excel Dashboards
    • Power Pivot & DAX
  • Power BI
  • Template Store
    • Ready to Use Templates
  • Courses
  • Academy
    • Excel + AI Mastery: 100 Formulas
    • Excel Pivot Tables & Dashboards
  • About Us
  • Contact Us
Copyright © 2023 PK-AnExcelExpert.com - Privacy Policy