New: NextGenTemplates Academy - video courses on Excel formulas with AI and Pivot Tables & dashboards. Early-bird: 20% off with code EARLYBIRD20 - first 20 orders only. See the courses →
  • Learn Excel (Free Course)
    • 1. Shortcut Keys
    • 2. Fill & Flash Fill
    • 3. Find & Replace
    • 4. Sort & Filter
    • 5. Formulas & Functions
    • 6. Data Validation
    • 7. Conditional Formatting
    • 8. Basic Charts
    • 9. Advanced Charts
    • 10. Pivot Tables
    • 11. Excel Dashboards
    • 12. VBA Course
    • 13. Excel Formulas with AI
  • Templates
  • Tutorials
    • Charts and Visualization
    • VBA
    • Excel Tips and Tricks
    • Excel Dashboards
    • Power Pivot & DAX
  • Power BI
  • Template Store
    • Ready to Use Templates
  • Courses
  • Academy
    • Excel + AI Mastery: 100 Formulas
    • Excel Pivot Tables & Dashboards
  • About Us
  • Contact Us

PK: An Excel Expert

Transforming Data into Decisions

Tag: Excel Reporting Dashboard

Dashboard Templates

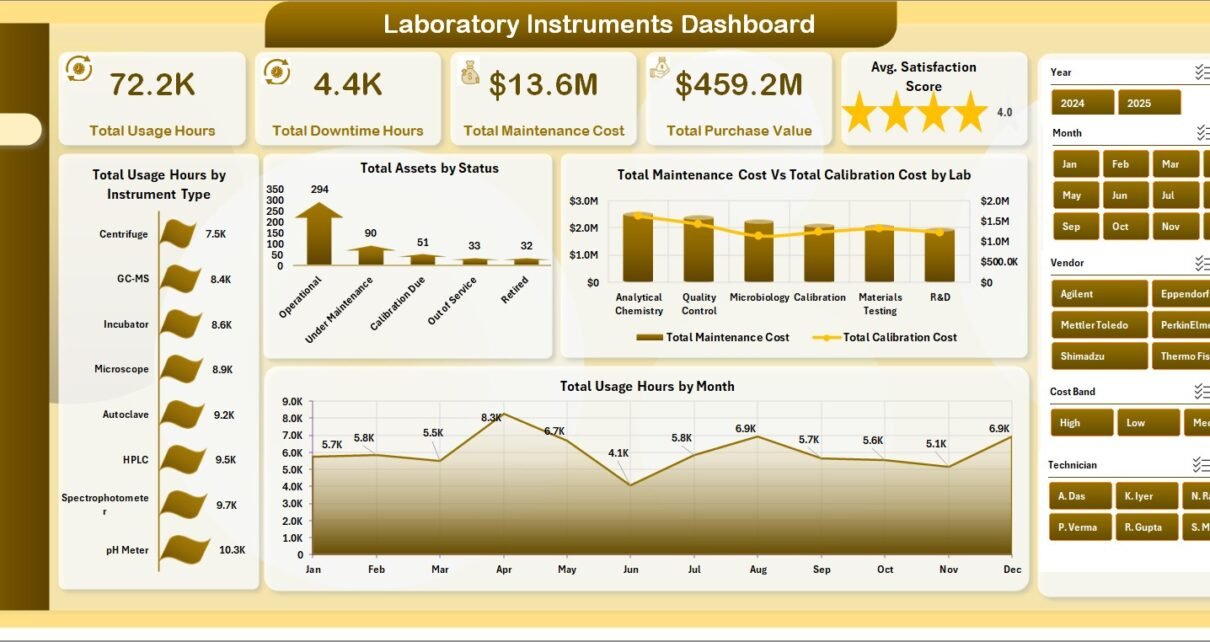
Laboratory Instruments Dashboard in Excel

June 29, 2026June 29, 2026 PKComments Off on Laboratory Instruments Dashboard in Excel
Laboratory Instruments Dashboard in Excel is a ready-to-use reporting template for labs that need clearer visibility into instrument usage, downtime, maintenance cost, calibration cost, asset value, test runs, and inventory
Read More
Dashboard

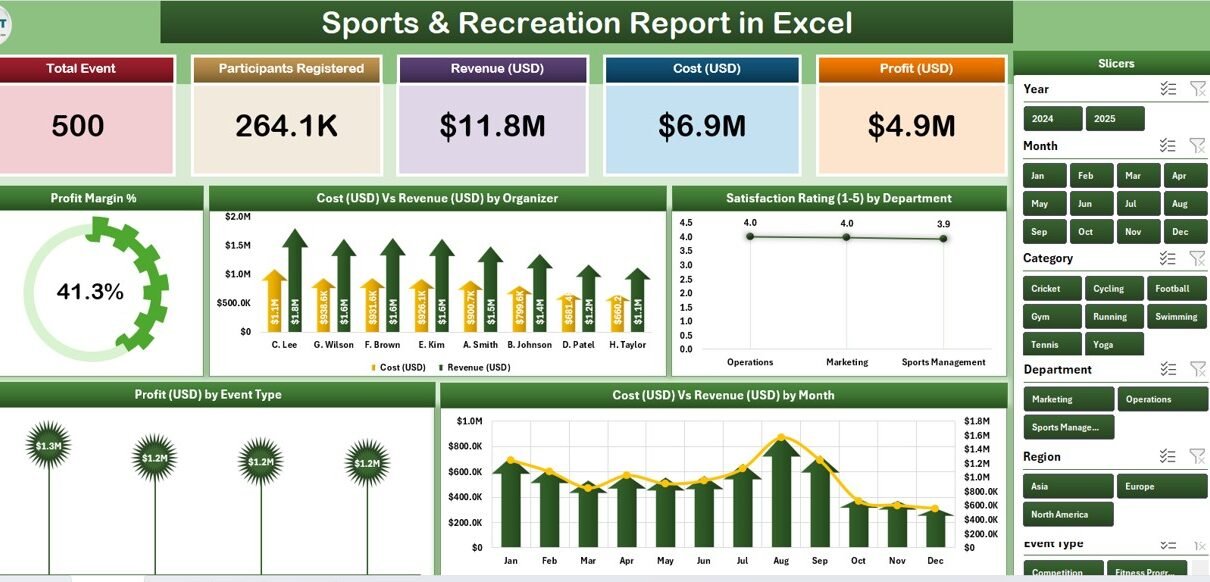
Sports & Recreation Report in Excel

May 17, 2026May 17, 2026 PKComments Off on Sports & Recreation Report in Excel
The global sports and recreation market is projected to surpass $614 billion by 2027 (Allied Market Research, 2024), and clubs, fitness studios, and recreation centers now juggle 5–15 event organizers
Read More
Dashboard Templates

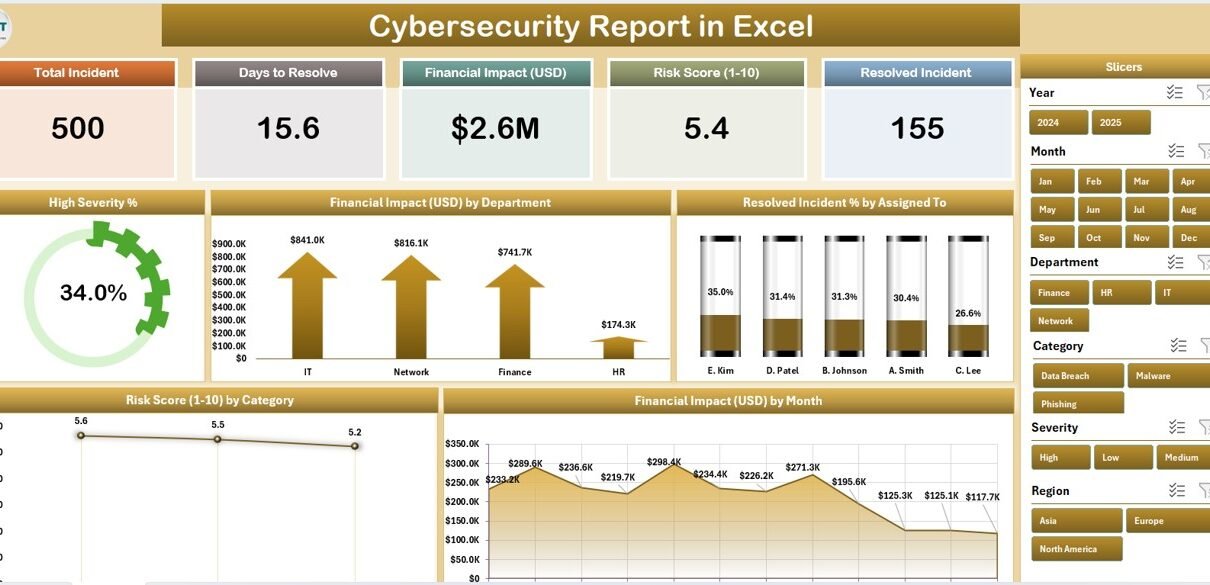
Cybersecurity Report in Excel

May 11, 2026May 11, 2026 PKComments Off on Cybersecurity Report in Excel
Cybersecurity teams at mid-size companies log an average of 200+ security incidents per month, yet 67% still track them in unstructured spreadsheets without consistent severity scoring, financial impact mapping, or
Read More
Dashboard

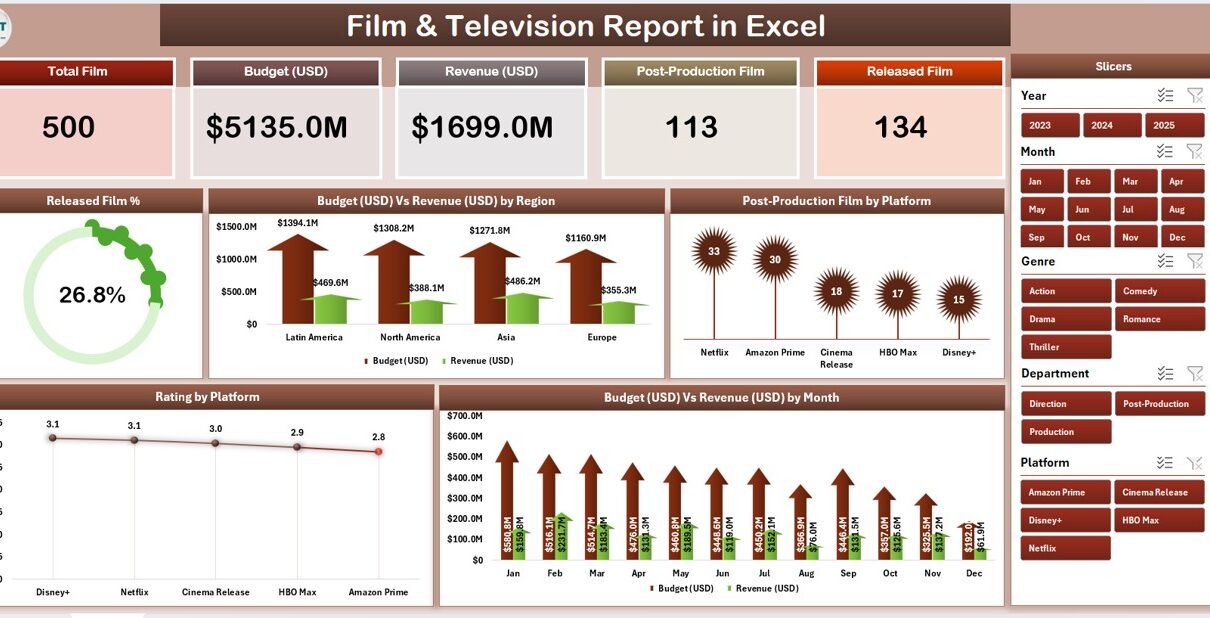
Film & Television Report in Excel

May 6, 2026May 6, 2026 PKComments Off on Film & Television Report in Excel
The global film and television industry generated over $250 billion in revenue in 2023, yet most production companies, media analysts, and entertainment operations teams still rely on ad-hoc spreadsheets or
Read More
Dashboard

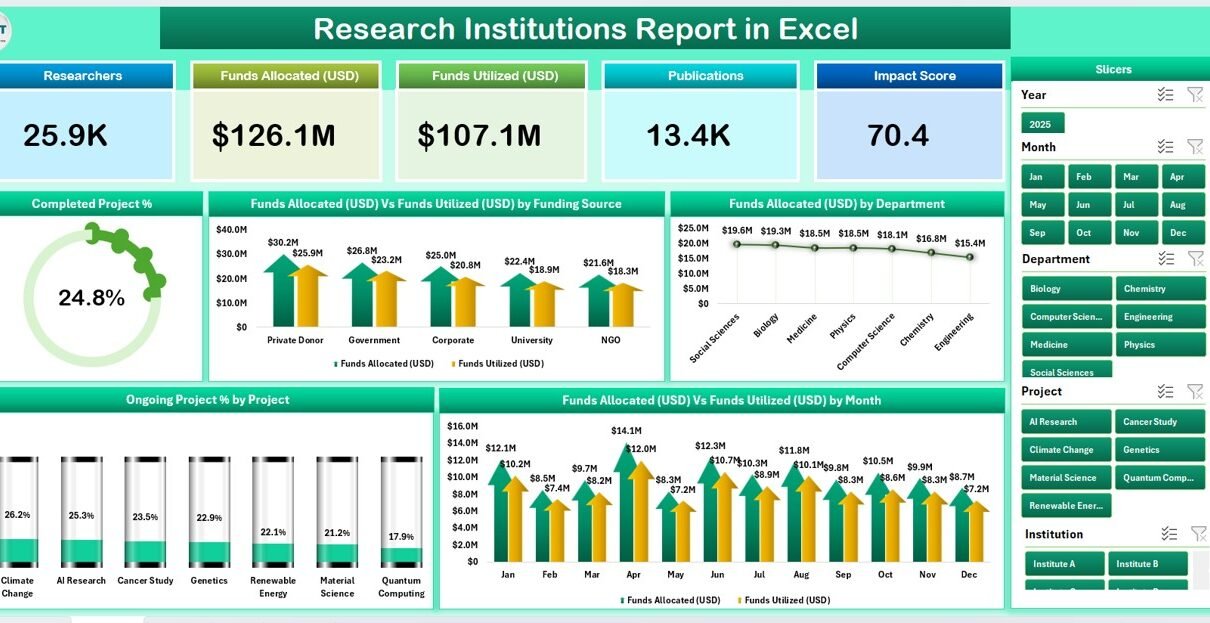
Research Institutions Report in Excel

May 3, 2026May 3, 2026 PKComments Off on Research Institutions Report in Excel
The Research Institutions Report in Excel consolidates 4 working sheets, 5 KPI cards, and 5 interactive charts into a single Excel workbook that tracks completed projects, ongoing projects, funds allocated,
Read More
Dashboard

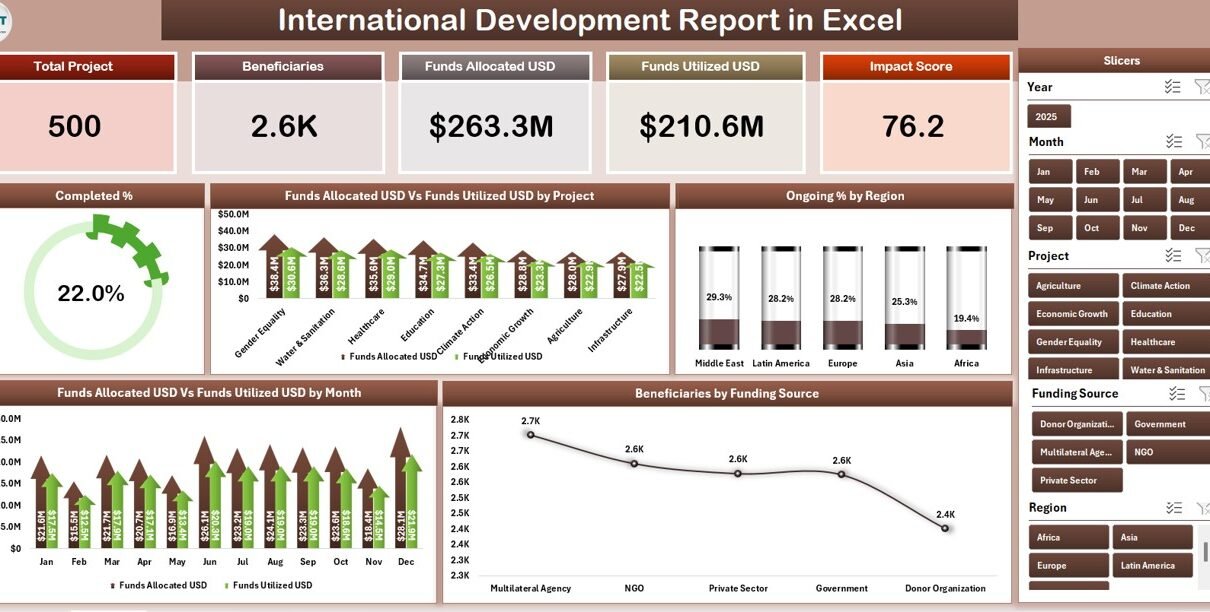
International Development Report in Excel

May 2, 2026May 2, 2026 PKComments Off on International Development Report in Excel
The International Development Report in Excel tracks 5 headline KPIs across 4 sheets, with 5 interactive charts and dual slicers covering project, region, funding source, and month. According to the
Read More
Dashboard

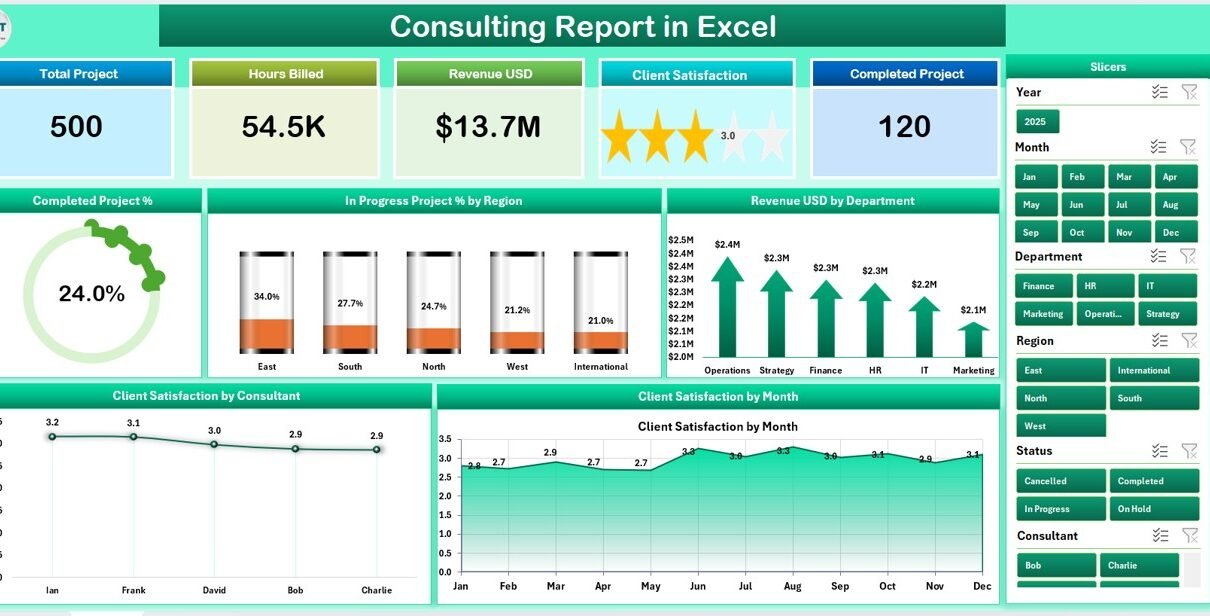
Consulting Report in Excel

April 27, 2026April 27, 2026 PKComments Off on Consulting Report in Excel
The Consulting Report in Excel tracks 5 core consulting KPIs across 4 structured sheets, with 5 pre-built charts and two slicers covering Completed Project %, In Progress Project % by
Read More
Dashboard

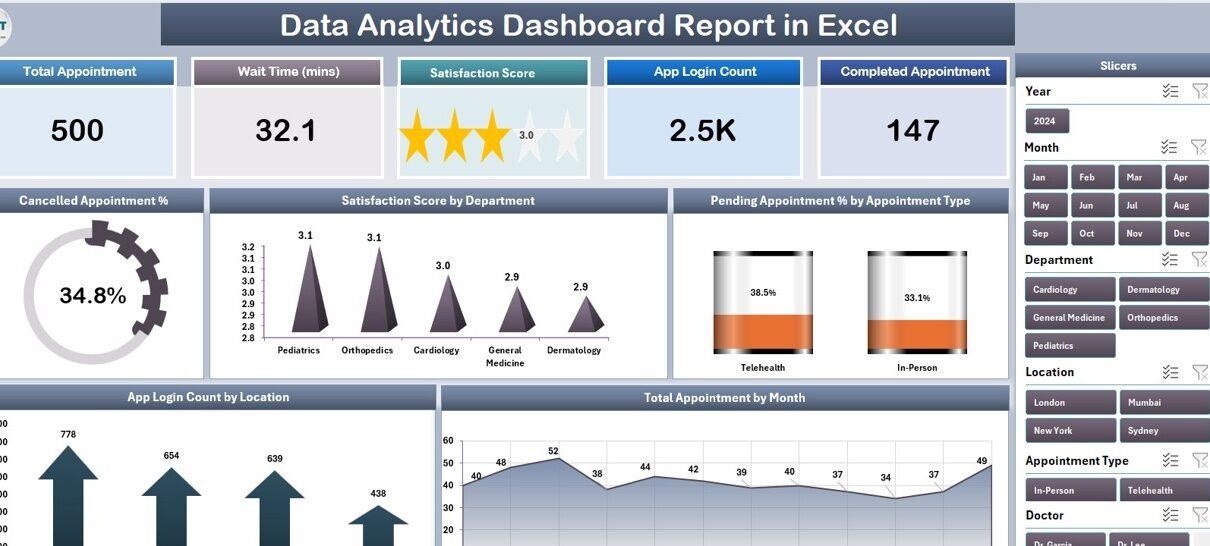
Data Analytics Dashboard Report in Excel

April 26, 2026April 26, 2026 PKComments Off on Data Analytics Dashboard Report in Excel
The Data Analytics Dashboard Report in Excel is a 4-worksheet appointment-analytics report that tracks 5 headline KPIs across Summary, Report, Data, and Support sheets. It uses 5 charts, two slicer
Read More
Dashboard

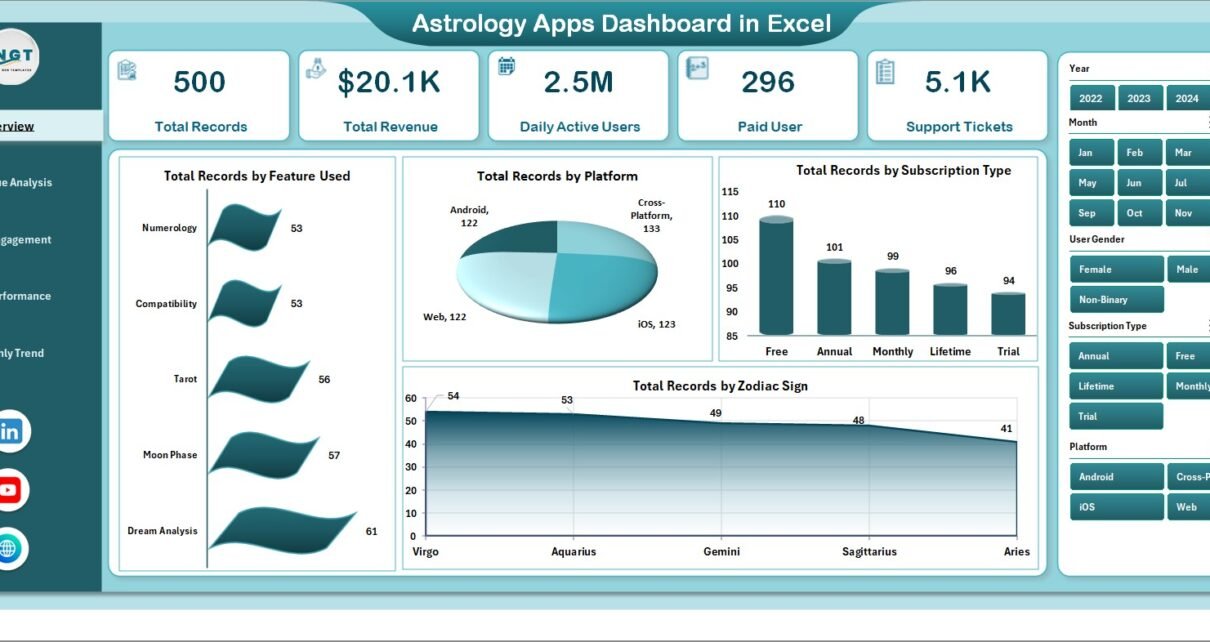
Astrology Apps Dashboard in Excel

March 14, 2026March 14, 2026 PKComments Off on Astrology Apps Dashboard in Excel
Astrology apps have become extremely popular in recent years. Millions of users open astrology apps every day to check horoscopes, zodiac predictions, birth charts, compatibility reports, and spiritual guidance. Because
Read More
Dashboard

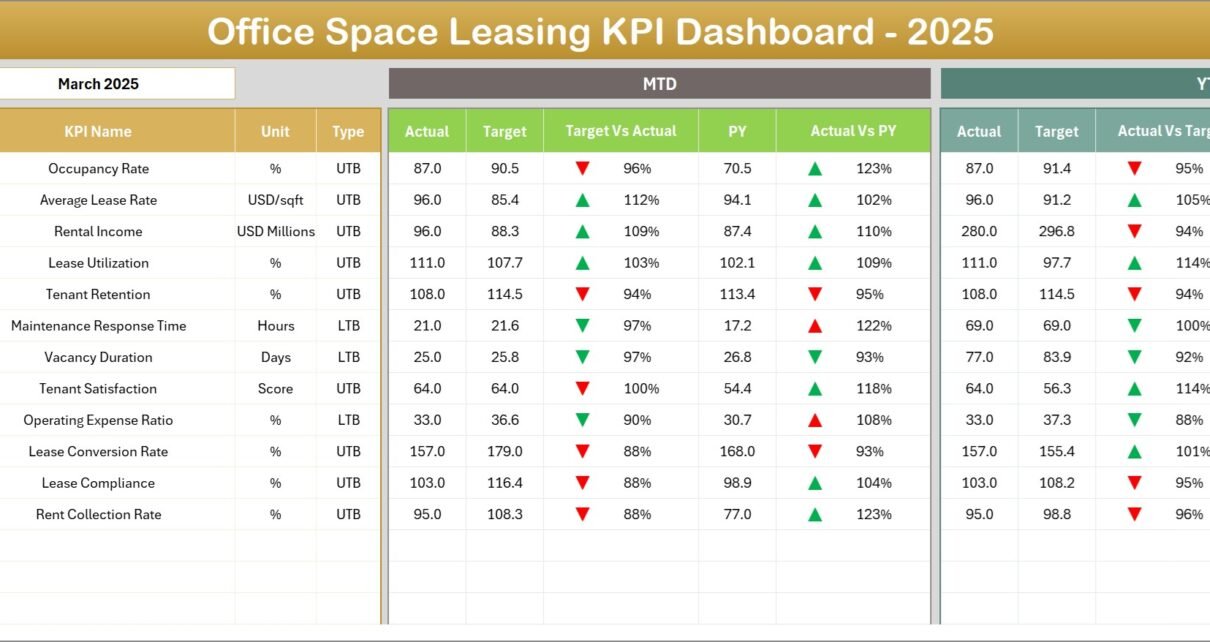
Office Space Leasing KPI Dashboard in Excel

March 11, 2026March 11, 2026 PKComments Off on Office Space Leasing KPI Dashboard in Excel
Managing office space leasing operations requires accurate tracking of performance metrics such as occupancy rates, lease renewals, rental income, tenant retention, and property utilization. Without proper monitoring, property managers often
Read More

Posts pagination

1 2 … 4 Next
  • Learn Excel (Free Course)
    • 1. Shortcut Keys
    • 2. Fill & Flash Fill
    • 3. Find & Replace
    • 4. Sort & Filter
    • 5. Formulas & Functions
    • 6. Data Validation
    • 7. Conditional Formatting
    • 8. Basic Charts
    • 9. Advanced Charts
    • 10. Pivot Tables
    • 11. Excel Dashboards
    • 12. VBA Course
    • 13. Excel Formulas with AI
  • Templates
  • Tutorials
    • Charts and Visualization
    • VBA
    • Excel Tips and Tricks
    • Excel Dashboards
    • Power Pivot & DAX
  • Power BI
  • Template Store
    • Ready to Use Templates
  • Courses
  • Academy
    • Excel + AI Mastery: 100 Formulas
    • Excel Pivot Tables & Dashboards
  • About Us
  • Contact Us
Copyright © 2023 PK-AnExcelExpert.com - Privacy Policy