Cybersecurity teams at mid-size companies log an average of 200+ security incidents per month, yet 67% still track them in unstructured spreadsheets without consistent severity scoring, financial impact mapping, or resolution rate visibility. The Cybersecurity Report in Excel solves this with a structured 2-page reporting template, 5 pre-built interactive charts, dual slicers, 5 KPI cards, and a full incident-level information table — all in a native Excel file requiring no macros, no VBA, and no cloud subscription.
🌍 Trusted by 8,400+ teams in 40+ countries, NextGenTemplates delivers one-time-purchase Excel, Google Sheets, Power BI, and HTML templates that replace expensive SaaS subscriptions.
✅ Instant download · One-time payment · No subscription · Lifetime access
Key Features of Cybersecurity Report in Excel
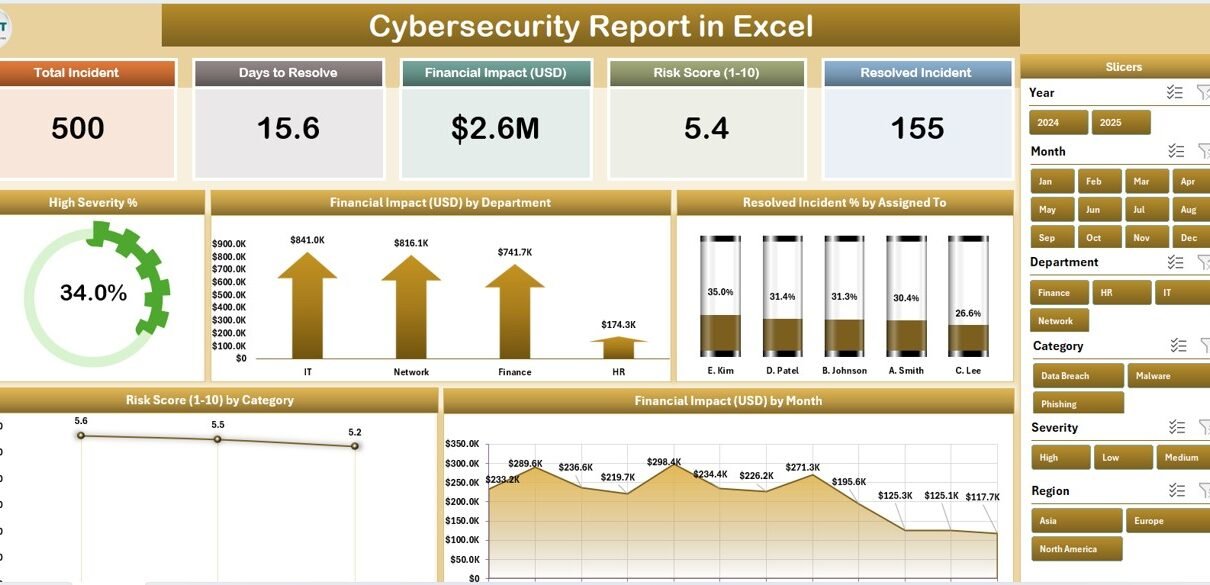
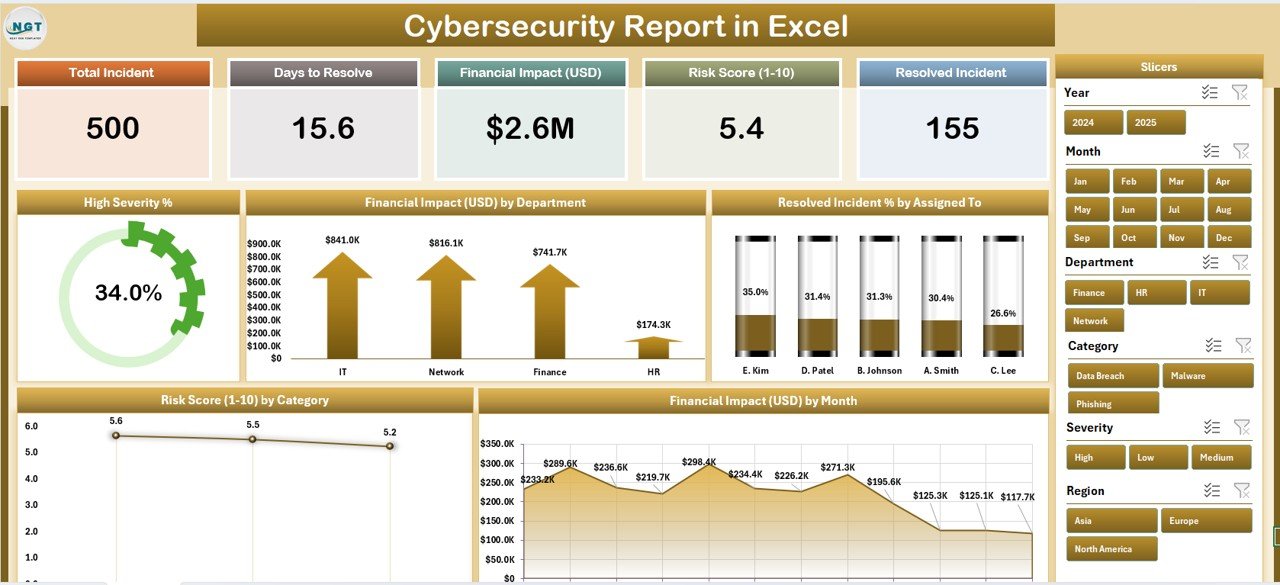
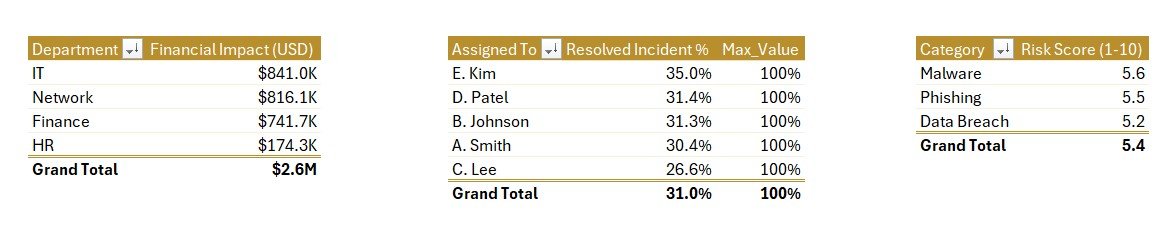
The Cybersecurity Report in Excel delivers 12+ trackable security metrics across 2 dedicated pages with 5 pre-built charts. The report tracks High Severity %, Financial Impact by Department, Resolved Incident % by Assigned To, Risk Score by Category, and Financial Impact by Month — five of the most critical dimensions for structured cybersecurity reporting at the SMB level.
Interactive Slicers on Both Pages: A right-side slicer on the Summary Page and a left-side slicer on the Report Page give you instant one-click filtering by incident category, department, assigned analyst, or severity. No formula editing required — every chart and KPI card updates in real time.
5 KPI Cards at a Glance: The Summary Page top section displays five headline metrics pre-calculated from your Data Sheet: Total Incidents logged, High Severity Count, Resolved Incident %, Total Financial Impact, and Average Risk Score.
Incident-Level Information Table: The Report Page combines a slicer with a comprehensive data table showing every logged security event with date, category, severity, department, analyst assignment, resolution status, financial impact, and risk score — ready for internal audit trail documentation.
No Macros or Add-ins Required: Built entirely with native Microsoft Excel Pivot Tables and Slicers. Compatible with Excel 2016, 2019, and Microsoft 365 desktop. No VBA, no external plugins, no cloud connectivity required. According to Microsoft Learn’s documentation on PivotTable Slicers, slicers are natively supported across all modern Excel desktop versions.
Dashboard Pages Explanation
Summary Page — 5 KPI Cards and 5 Interactive Charts with Right-Side Slicer
1. Summary Page
The Summary Page is the executive-level view of your cybersecurity incident posture. Five KPI cards run across the top displaying Total Incidents, High Severity Count, Resolved Incident %, Total Financial Impact, and Average Risk Score. The right-side slicer provides instant filtering without navigating away. Five chart panels below visualize incident severity, financial exposure by department, resolution performance by assigned analyst, risk classification by category, and financial trends by month.
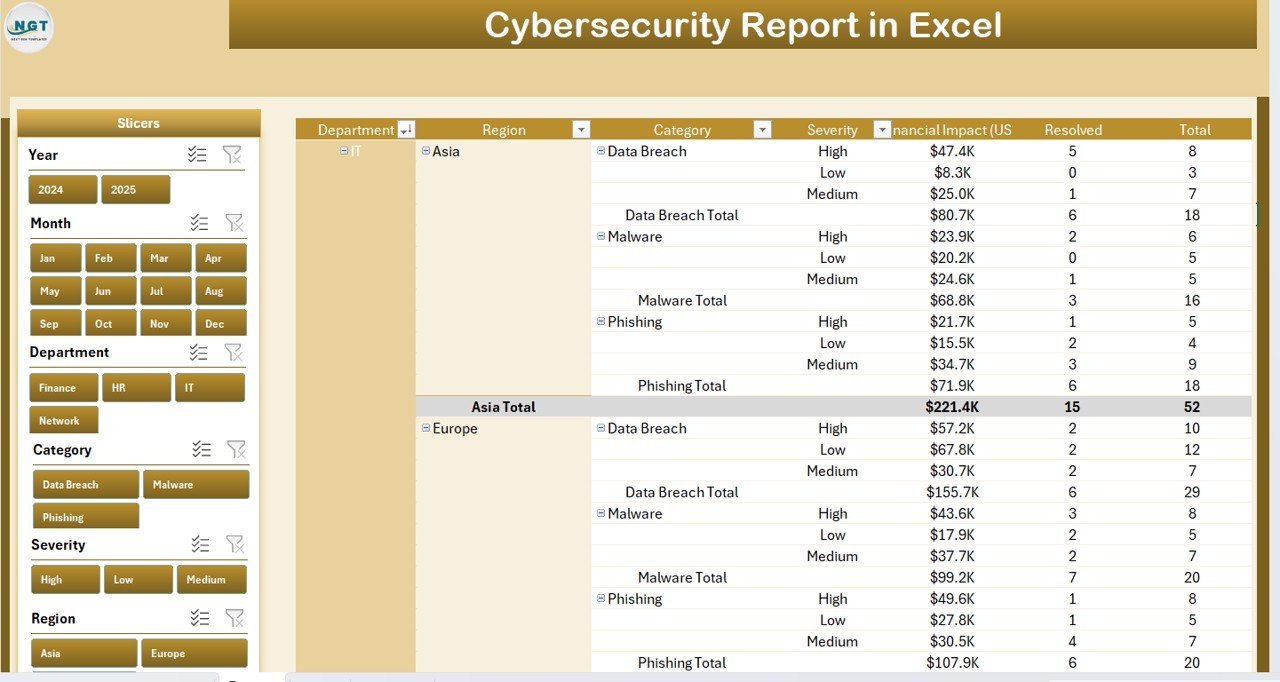
Report Page — Left-Side Slicer and Incident Information Table
2. Report Page
The Report Page features a left-side slicer combined with a comprehensive incident-level Information Table. This is the operational layer of the report where analysts drill into individual incidents, review assignment and closure details, cross-reference financial exposure, and document evidence for audit responses. The slicer and table work together to make filtering a specific department or category’s incident history a single click.
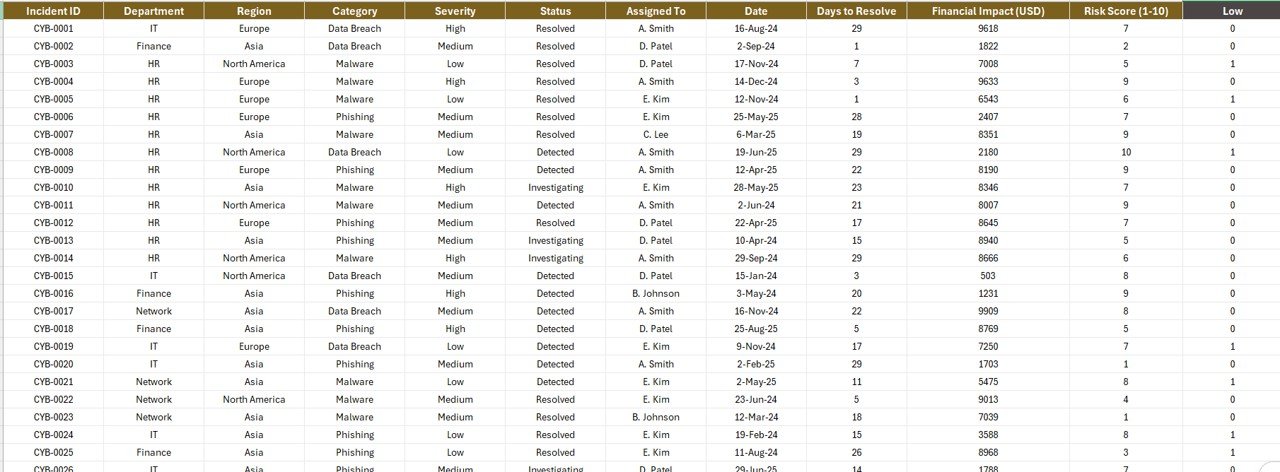
3. Data Sheet
The Data Sheet is the backbone of the entire Cybersecurity Report in Excel. All raw incident records are entered here with structured columns for incident date, category, severity level, department, assigned analyst, resolution status, financial impact (in currency), and risk score. All five charts and all five KPI cards pull directly from this sheet — paste in your data and every visual updates instantly.
Data Sheet and Support Sheet for Structured Data Input
4. Support Sheet
The Support Sheet provides all dropdown configuration lists for departments, incident categories, severity levels, and analyst names. Editing these lists updates the slicer options and chart labels throughout the entire report. This keeps data entry consistent, prevents typos from breaking pivot logic, and makes the template fully reusable across different teams or clients.
Cybersecurity Report in Excel vs. Google Sheets Equivalent vs. Paid SIEM — Feature Comparison
| Feature | Cybersecurity Report in Excel | Google Sheets Equivalent | Paid SIEM (Splunk / IBM QRadar) |
|---|---|---|---|
| Cost | $7.99 one-time | Free (manual build) | $15,000–$100,000+/year |
| Platform | ✅ Microsoft Excel | Google Sheets (browser) | Cloud/On-premise |
| Setup Time | ✅ Under 10 minutes | 2–5 hours to build | Weeks to months |
| Real-time Automated Alerts | No (manual refresh) | No (manual refresh) | ✅ Yes |
| Interactive Slicers | ✅ Yes (2 pages) | No native slicers | ✅ Yes (advanced) |
| Works Offline | ✅ Yes | No (browser-based) | No |
| Customizable Fields | ✅ Fully customizable | ✅ Fully customizable | Limited (licensed modules) |
| Year-1 Cost (5 users) | $7.99 total | Free (5 hrs setup) | $75,000+ enterprise |
For IT and security teams that need structured incident reporting without a six-figure SIEM budget, the Cybersecurity Report in Excel sits in the sweet spot.
Who Should Use This Template
Perfect for:
- IT managers and CISOs at SMBs (10–500 employees) who need structured monthly incident reporting without enterprise software
- Security analysts tracking incident severity trends, department-level financial exposure, and analyst resolution performance
- Compliance teams preparing audit-ready documentation for ISO 27001, SOC 2, or NIST Cybersecurity Framework requirements
- IT consultants delivering monthly cybersecurity status reports to clients who work in Excel
Not a fit if:
- Your SOC requires real-time automated log correlation and threat intelligence integration (use a dedicated SIEM instead)
- You need multi-tenant cloud deployment with role-based access controls and automated playbooks
- Your environment requires live API connections to firewall logs, EDR tools, or SOAR platforms
Real-World Use Cases
Marcus is an IT Manager at a 120-person financial services firm. His CISO expects a monthly cybersecurity incident summary covering severity breakdown, financial exposure, and resolution rates by department. Before using the Cybersecurity Report in Excel, Marcus spent 4 hours each month manually pulling data into a spreadsheet. Now he updates the Data Sheet, adjusts the slicer to the reporting month, and exports the Summary Page as a PDF — the entire process takes 20 minutes.
Priya runs a cybersecurity consulting practice serving 8 SMB clients across manufacturing, healthcare, and retail. She maintains one customized copy of the Cybersecurity Report in Excel per client, with each client’s department names and analyst assignments configured in the Support Sheet. Each month she delivers a polished, branded incident report showing risk score trends, resolved incident percentages by analyst, and financial impact by department — without any per-client licensing fees.
An IT compliance team at a mid-size manufacturer uses the Cybersecurity Report in Excel to support their annual ISO 27001 surveillance audit. The Risk Score by Category chart maps directly to their Annex A control domains, and the Resolved Incident % by Assigned To chart gives their external auditor clear evidence of systematic incident closure — documented in a format the auditor already knows how to read.
Advantages of Cybersecurity Report in Excel
The primary advantage of the Cybersecurity Report in Excel over manual tracking is the automatic update behavior — change one row in the Data Sheet and all five charts, all five KPI cards, and the Report Page information table reflect the change instantly. Teams that previously spent hours reformatting monthly pivot tables reduce that to minutes.
The dual-slicer design (right-side on Summary, left-side on Report) is particularly useful for presenting to different audiences: the Summary Page slicer filters the executive overview for management presentations, while the Report Page slicer enables analyst-level incident drill-down for internal reviews or audit evidence gathering.
Because the template uses only native Excel features, there are no compatibility issues, no macro security warnings to navigate, and no IT approval required for deployment. Any team member with standard Excel can open, update, and share the file.
Opportunities for Improvement
The Cybersecurity Report in Excel is a manual reporting tool — it does not auto-import data from security systems, ticketing platforms, or SIEM logs. Teams that need automated data ingestion should consider integrating an upstream data export (e.g., a CSV export from their ticketing system) as their Data Sheet source, rather than expecting live feed capability from this template.
The template also does not include built-in alerting or notification logic. Organizations that need threshold-based alerts (e.g., automatic email when High Severity count exceeds a threshold) would need to layer that on separately using Excel’s built-in conditional formatting or a connected Power Automate workflow.
Best Practices
- Update the Support Sheet’s dropdown lists before your first data entry session to match your actual department and analyst structure — this ensures all slicer filters reflect real names from day one.
- Use a consistent date format across the Data Sheet (e.g., YYYY-MM-DD) to ensure the Financial Impact by Month chart groups correctly.
- Archive each month’s completed Data Sheet tab before overwriting with new data — this builds a historical record without requiring a separate tracking system.
- When presenting to leadership, use the Summary Page slicer to pre-filter to the relevant reporting period before sharing your screen or exporting to PDF.
Explore Relevant Templates
📌 IT Help Desk Dashboard in Excel — Track ticket volume, SLA compliance, and resolution times for your help desk operations alongside your cybersecurity reporting.
📌 Cybersecurity Incident KPI Dashboard in Google Sheets — Cloud-based alternative for teams running Google Workspace instead of Microsoft 365.
📌 Cybersecurity Risk Assessment KPI Dashboard in Power BI — Advanced Power BI visualizations for teams that need deeper interactive risk analysis across large incident datasets.
📌 Browse all IT & Technology Templates on NextGenTemplates.com
Frequently Asked Questions
What KPIs does the Cybersecurity Report in Excel track?
The Cybersecurity Report in Excel tracks five headline KPI cards — Total Incidents, High Severity Count, Resolved Incident %, Total Financial Impact, and Average Risk Score — plus five chart-level metrics: High Severity %, Financial Impact by Department, Resolved Incident % by Assigned To, Risk Score by Category, and Financial Impact by Month. All metrics update automatically from the Data Sheet.
Does the Cybersecurity Report in Excel require VBA or macros?
No. The Cybersecurity Report in Excel is built entirely with native Excel Pivot Tables and Slicers. No macros, VBA code, or third-party add-ins are required. It works on any standard Microsoft Excel 2016, 2019, or Microsoft 365 desktop installation without enabling macros or changing security settings.
What Excel version do I need?
The Cybersecurity Report in Excel requires Microsoft Excel 2016, 2019, or Microsoft 365 (desktop application). The interactive slicer functionality is not available in Excel Online. Older versions such as Excel 2010 or 2013 are not supported due to Pivot Table Slicer compatibility requirements.
How does this compare to paid SIEM tools like Splunk or IBM QRadar?
SIEM platforms provide real-time automated log correlation and threat alerting at enterprise scale — but cost $15,000–$100,000+ per year. The Cybersecurity Report in Excel is a structured manual incident reporting tool designed for SMB IT teams and consultants who need organized, audit-ready documentation without six-figure software investment.
Can I customize the departments, categories, and analyst names?
Yes. The Support Sheet contains all dropdown configuration lists used across the template. Edit the department list, incident category list, severity scale, and analyst roster and those changes propagate to all slicer options and chart labels automatically. No formula editing required.
How long does initial setup take?
Most users complete initial setup in under 10 minutes. Open the file in Excel, go to the Support Sheet and update the dropdown lists with your team’s actual names and departments, paste your incident records into the Data Sheet, and the Summary Page is ready for immediate use with all charts and KPI cards populated.
Is this template suitable for ISO 27001 or SOC 2 reporting?
The Cybersecurity Report in Excel is well-suited for documenting incident logs, severity classifications, resolution rates, and financial impact in a structured, auditable format that supports ISO 27001 and SOC 2 evidence gathering. It is a reporting tool, not a compliance management platform — pair it with a formal risk register for full framework coverage.
About the Author
Built by PK — Microsoft Certified Professional with 15+ years of Excel, Google Sheets, and Power BI experience. Founder of NextGenTemplates, reaching 300K+ subscribers across YouTube channels (@PK-AnExcelExpert, @NextGenTemplates, @NeoTechNavigators). Every template is hand-built and tested before release.
Conclusion
The Cybersecurity Report in Excel gives IT managers, security analysts, and compliance teams a structured, slicer-driven reporting tool that delivers five interactive charts, five KPI cards, and an incident-level information table — all from a single native Excel file. At $7.99 with a one-time payment and instant download, it replaces hours of manual spreadsheet formatting each month without the cost or complexity of enterprise SIEM software.
Click here to Purchase the Cybersecurity Report in Excel
✅ Instant download · One-time payment · No subscription · Lifetime access
📺 Youtube.com/@PK-AnExcelExpert — Watch step-by-step tutorials on Excel reporting, dashboards, and templates.
📅 Last updated: May 2026