The Research Institutions Report in Excel consolidates 4 working sheets, 5 KPI cards, and 5 interactive charts into a single Excel workbook that tracks completed projects, ongoing projects, funds allocated, and funds untied across every department and funding source. Setup takes under 10 minutes — replace the sample records on the Data sheet, and every chart, slicer, and KPI card on the Summary and Report pages refreshes automatically. Built specifically for research institutions, university R&D offices, grant managers, and policy think tanks who need an executive-ready report without paying for a per-seat reporting tool.
🌍 Used by 8,400+ teams in 40+ countries who replaced paid SaaS reporting tools with one-time-purchase Excel, Google Sheets, and Power BI templates from NextGenTemplates.
✅ Instant download · One-time payment · No subscription · No per-user fees · Lifetime access
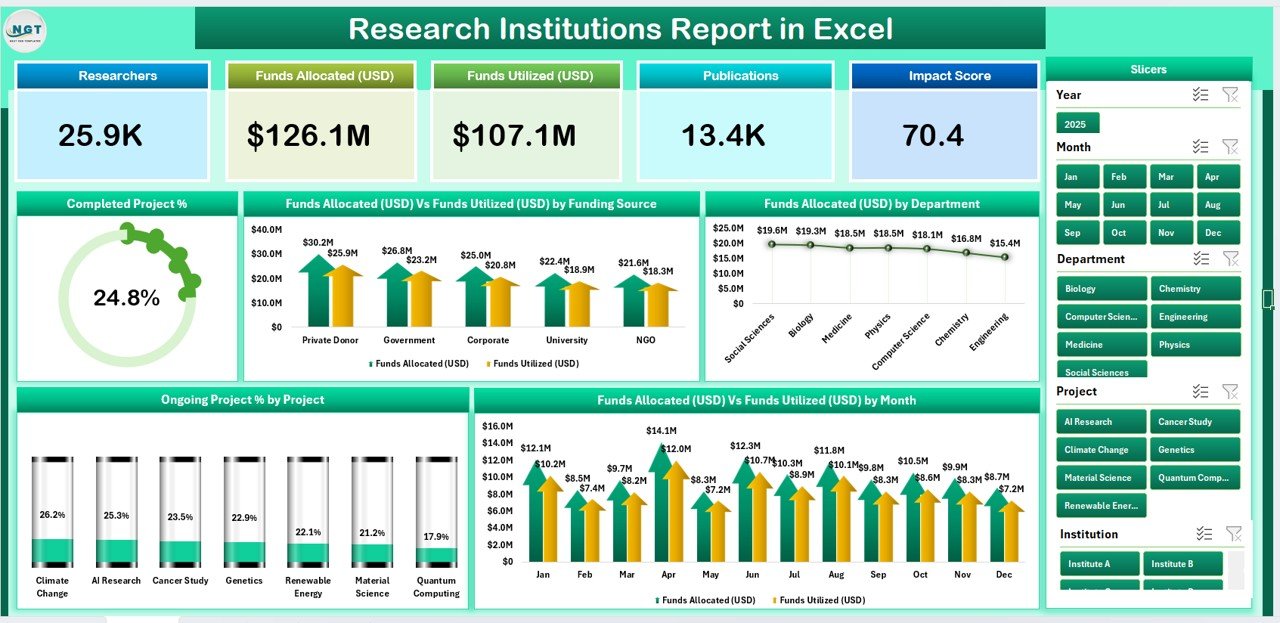
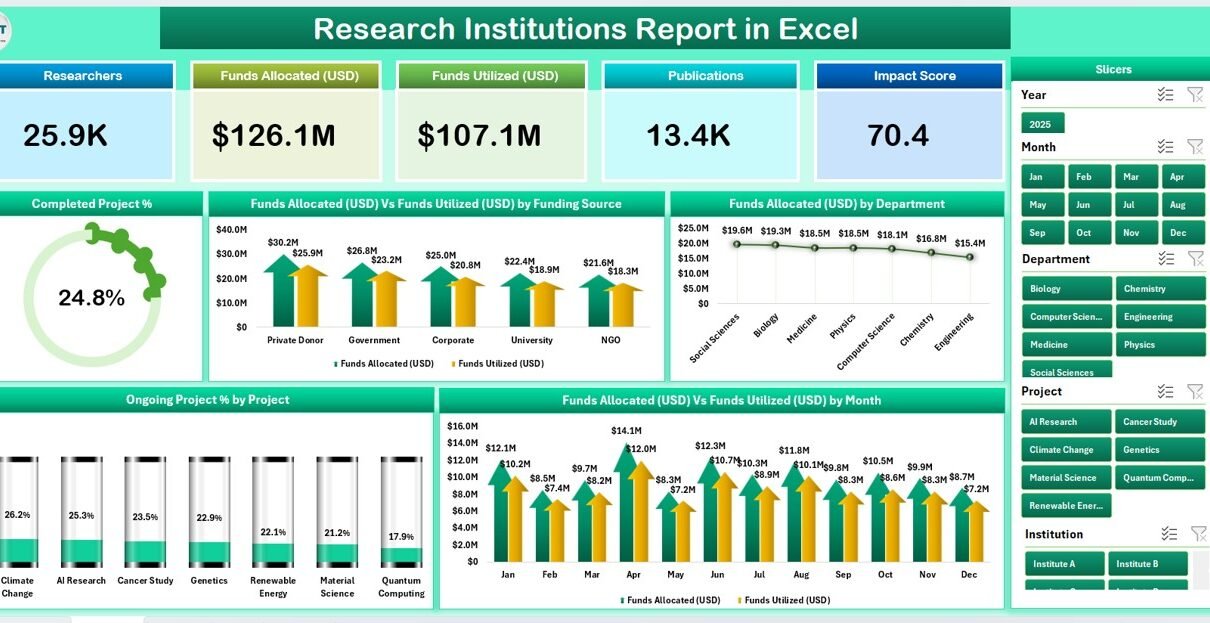
Summary page — 5 KPI cards, slicer, and 5 charts covering project status and funding
Introduction to the Research Institutions Report in Excel
Research institutions juggle dozens of funded projects across multiple departments, funding sources, and timelines. Pulling a single up-to-date status report — completed projects vs. ongoing, allocated vs. untied funds, department breakdown, monthly burn — typically takes hours of copy-paste work each month. The Research Institutions Report in Excel collapses that work into a single Excel file: enter each project once on the Data sheet, and every visual on the Summary and Report pages rebuilds itself.
The workbook follows a four-sheet structure used in production reporting templates across higher education, government research, and non-profit research environments. It works in Microsoft Excel 2016 onward, Microsoft 365, and Excel for Mac. No add-ins, no macros, no enabling content prompts — the file emails cleanly and opens cleanly on any restricted-IT laptop.
Key Features of the Research Institutions Report in Excel
📊 4 working sheets in one workbook — a Summary page for executives, a Report page for project-by-project deep dives, a Data sheet for raw entries, and a Support sheet for dropdown lists. Every page draws from the same dataset, so a single edit propagates across every chart, KPI card, and table without manual rework.
📌 5 KPI cards on the Summary page covering total projects, completed projects, ongoing projects, total funds allocated, and total funds untied. Each card uses simple SUMIFS formulas — no macros, no add-ins, nothing that breaks when the file is emailed across departments.
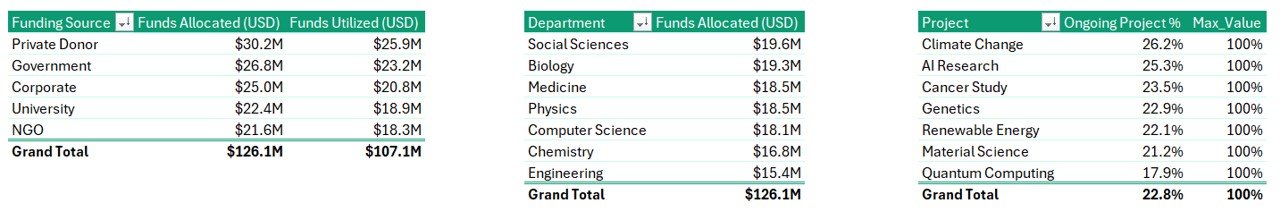
📈 5 pre-built charts on the Summary page — Completed Project %, Funds Allocated vs. Funds Untied by Funding Source, Funds Allocated by Department, Ongoing Project % by Project, and Funds Allocated vs. Funds Untied by Month. The charts are pivot-driven and rebuild themselves when new project rows hit the Data sheet.
🎛️ Slicer-based filtering on every page — the Summary page hosts a right-side slicer; the Report page hosts a left-side slicer. Click any value (department, funding source, status) and every visible chart, KPI, and information row responds instantly across the file.
📋 Detailed Information Table on the Report page showing project name, status, funding source, department, allocated amount, untied amount, start date, and progress, all filterable from the same slicer that drives the page. This is the deep-dive view used during quarterly reviews and audit walkthroughs.
🧮 No VBA, no add-ins, no setup wizard — opens in Microsoft Excel 2016 onward, including Microsoft 365 and Excel for Mac. The file passes through corporate email filters and opens on managed laptops where macros are blocked by IT policy.
Sheets Explanation — How the Research Institutions Report in Excel Is Structured
1. Summary Page — The executive view. Five KPI cards anchor the top of the page, a vertical slicer runs down the right side, and a 5-chart grid covers Completed Project %, Funds Allocated vs. Funds Untied by Funding Source, Funds Allocated by Department, Ongoing Project % by Project, and Funds Allocated vs. Funds Untied by Month. This is the page printed for board packets and grant-funder updates.
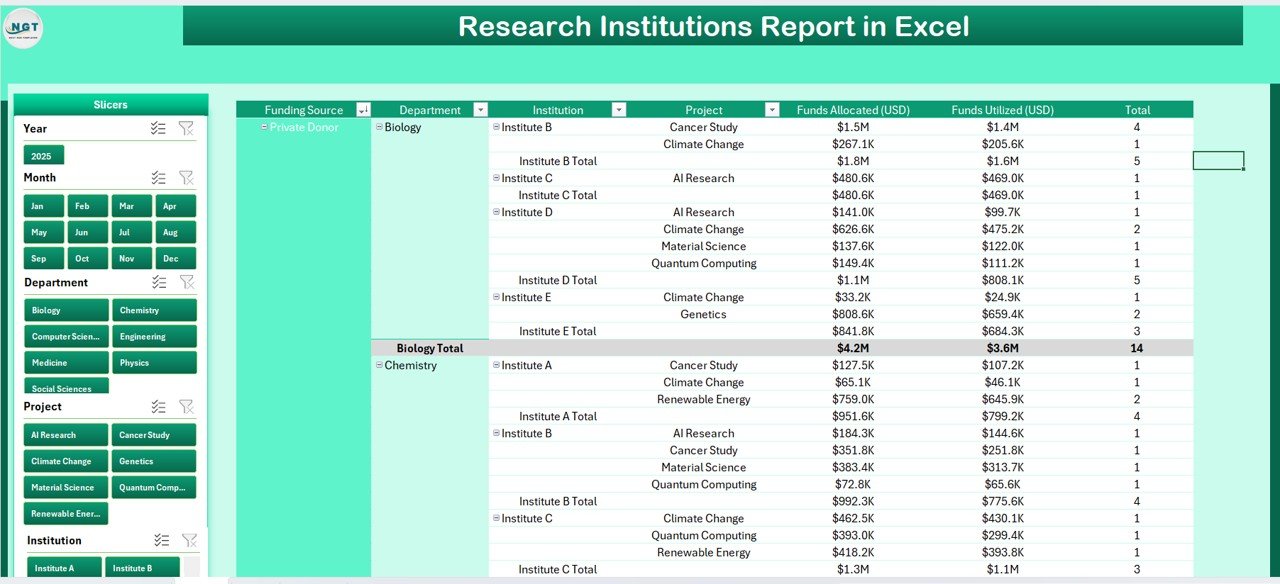
Report page — left-side slicer + project-level Information Table
2. Report Page — The deep-dive view. A left-side slicer pairs with a wide Information Table that reads every project record, with columns for project, department, funding source, allocated amount, untied amount, status, and dates. Filter the slicer to drill into any subset — e.g., “show me only Biology department projects funded by NIH” — and the table redraws instantly.
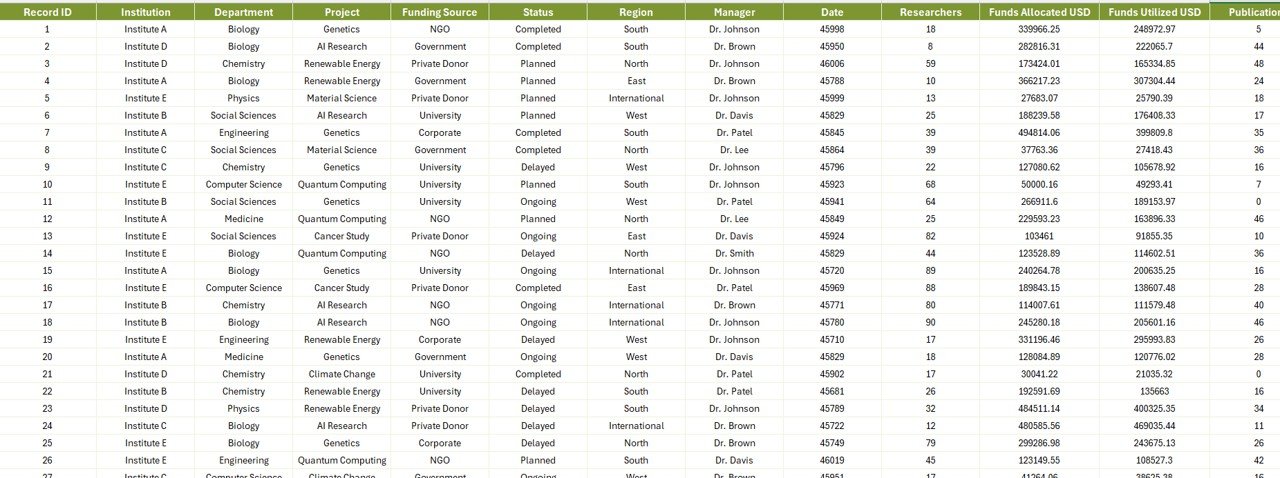
Data sheet — replace the sample rows with your own project records
3. Data Sheet — The single source of truth. Add, edit, or delete project rows here and every visual on the Summary and Report pages refreshes after a quick Refresh All. Pre-populated with sample project data so you can see the formulas and charts work before you replace them with your institution’s records.
Support sheet — dropdown lists for departments, funding sources, and project status
4. Support Sheet — Holds the dropdown lists used by the Data sheet — departments, funding sources, project statuses. Edit these once and every Data sheet validation drop-down updates immediately. Use this to standardize entries across multiple grant managers entering data into the same workbook.
Research Institutions Report in Excel vs. Google Sheets Equivalent vs. Paid Research Reporting SaaS — Feature Comparison
| Feature | Research Institutions Report in Excel | Google Sheets Equivalent | Paid Research Reporting SaaS (e.g., Cayuse, InfoEd) |
|---|---|---|---|
| Cost | $7.99 one-time | Free (DIY build) | $15,000–$80,000 / year |
| Platform | Excel 2016+, Microsoft 365, Excel for Mac | Google Sheets (browser) | Web SaaS, requires IT integration |
| Setup time | Under 10 minutes | 1–3 days to build from scratch | 3–9 months implementation |
| Slicer-based filtering | ✅ Two slicers (Summary + Report) | Filter views (slower) | ✅ Built-in filters |
| Pre-built KPI cards | ✅ 5 cards on Summary page | ❌ Build manually | ✅ Configurable |
| Pre-built charts | ✅ 5 pivot-driven charts | ❌ Build manually | ✅ Configurable |
| Funding source breakdown | ✅ Allocated vs. Untied by source | ❌ Build manually | ✅ Yes, but requires setup |
| Year-1 cost at 5 users | $7.99 one-time | Free + dev time | $15,000–$80,000+ |
| Works offline / emailable | ✅ Yes | ❌ Requires internet | ❌ Web-only |
For research offices that want a clean, slicer-driven funding and project report without paying enterprise SaaS pricing, the Research Institutions Report in Excel sits in the sweet spot.
Who Should Use This Template
✅ Perfect for:
- Research office managers at universities tracking 20–500 active projects across departments
- Grants administrators preparing quarterly funder updates and board packets
- Policy think tanks and non-profit research arms reporting on multi-year grant portfolios
- R&D leads in pharma, biotech, and engineering firms needing a quick funded-project status view
- Government research agencies producing department-level allocation reports
❌ Not a fit if:
- You need pre-award proposal routing and electronic signature workflow (use Cayuse / InfoEd)
- You need automated NIH / NSF system integrations and FFATA reporting
- You manage 5,000+ active projects and need a multi-user database with row-level access control
Real-World Use Cases
Sarah runs a 40-project research office at a mid-sized university. She uses the Research Institutions Report in Excel to give her dean a one-page Summary view each month — completed vs. ongoing project ratio, funds allocated vs. untied by department, and monthly burn trend. When a department head questions a number, she switches to the Report page, clicks the slicer for that department, and walks through every project line. Total monthly reporting time: 30 minutes, down from a full afternoon of pivot-table-rebuilding in her old workbook.
Marcus manages grants at a public-policy think tank. Each quarter he produces a funder report showing exactly how committed funds compare to untied (uncommitted) funds across his three programs. He drops a fresh export from his accounting system onto the Data sheet, hits Refresh All, and the Funds Allocated vs. Funds Untied by Funding Source chart redraws — ready for the funder PDF.
Priya leads R&D portfolio reporting at a biotech. She uses the Information Table on the Report page during her weekly portfolio review with the CSO — filtering by status to see which projects are stalled, then by funding source to see which grant categories are over- or under-utilized.
Advantages of the Research Institutions Report in Excel
💰 One-time $7.99 cost replaces what would otherwise be a multi-thousand-dollar annual subscription to a research-management SaaS tool. For an institution with 5–10 grant managers, that’s a 99%+ year-1 cost reduction.
⏱️ 10-minute setup vs. 3-month SaaS implementation. Drop your project records onto the Data sheet, edit dropdown lists on the Support sheet, and you have a working report. No vendor calls, no IT tickets, no SSO integration.
📤 Emailable. Because the file is pure Excel — no macros, no add-ins, no external data connections — it passes through every corporate email filter and opens on every managed laptop. Send it to a funder, a board member, or a partner institution without worrying about access provisioning.
🔁 Refresh-and-go workflow. Replace the sample rows once. Every month after that, paste your latest project list into the Data sheet, hit Refresh All on the ribbon, and the Summary and Report pages rebuild themselves.
Opportunities for Improvement
Honest limitations worth knowing before you buy:
🟡 Single-user editing. Excel files don’t support real-time multi-user editing the way Google Sheets or a SaaS does. If five people need to update project records simultaneously, this template isn’t built for that workflow — consider the Google Sheets equivalent instead.
🟡 No automated data ingestion. The Data sheet is manual paste-in. If you need a live link to your grants accounting system, you’ll need a SaaS or a custom Power Query setup.
🟡 Mobile editing is awkward. Excel slicers work but feel cramped on a phone screen. Read-only review on mobile is fine; data entry should happen on a laptop.
Best Practices
1. Standardize your dropdown lists first. Before adding real project data, edit the Support sheet so departments and funding sources match your institution’s official list. This prevents typos that fragment your charts.
2. Date every monthly snapshot. Save a copy of the file at month-end with a date in the filename (e.g., Research-Report-2026-04.xlsx) so you have a clean audit trail.
3. Use the Report page slicer during walkthroughs. When a stakeholder questions a Summary KPI, switch to the Report page and filter live — it’s faster and more credible than digging through pivot tables.
4. Pair with a KPI scorecard for trended views. The Research Institutions Report shows current state. For year-over-year KPI tracking, pair with the Open Universities KPI Dashboard in Excel or a similar trended template.
Explore Relevant Templates
If you found the Research Institutions Report in Excel useful, these related templates from our Excel Dashboard collection are worth a look:
- Open Universities KPI Dashboard in Excel — trended KPI tracking for higher-education institutions, with target vs. actual and previous-year comparisons.
- Think Tanks Dashboard in Excel — built for policy research organizations, with publication, funding, and event metrics.
- AI Research Labs Dashboard in Excel — focused on AI / ML research labs, with experiment, publication, and compute-spend tracking.
- Libraries & Archives KPI Dashboard in Power BI — Power BI variant for institutional libraries and archives.
Frequently Asked Questions
What does the Research Institutions Report in Excel track?
The Research Institutions Report in Excel tracks completed projects, ongoing projects, total funds allocated, and total funds untied across every department and funding source. The Summary page shows 5 KPI cards and 5 charts; the Report page shows a project-level information table — all filterable via slicers.
How long does setup take?
Setup of the Research Institutions Report in Excel takes under 10 minutes. Open the file, replace the sample rows on the Data sheet with your own project records, edit the Support sheet dropdown lists to match your institution, and hit Refresh All — every chart, KPI card, and slicer rebuilds itself automatically.
Does the Research Institutions Report in Excel use macros or VBA?
No. The Research Institutions Report in Excel is built entirely with native Excel features — pivot tables, SUMIFS formulas, slicers, and standard charts. There are no macros, no VBA code, and no add-ins required, so the file opens cleanly on managed corporate laptops where macros are blocked by IT policy.
Which Excel versions does the Research Institutions Report in Excel support?
The Research Institutions Report in Excel works with Microsoft Excel 2016, Excel 2019, Excel 2021, and Microsoft 365 on both Windows and Mac. It also opens in Excel Online for read-only viewing — though slicer interactions and pivot refreshes are best handled in the desktop app.
How does the Research Institutions Report in Excel compare to paid SaaS like Cayuse or InfoEd?
The Research Institutions Report in Excel is a one-time $7.99 download focused on reporting and visualization. Paid SaaS tools like Cayuse and InfoEd cost $15,000–$80,000 per year and add pre-award workflow, electronic signatures, and federal system integrations. If you only need clean reporting, this template covers 80% of the use case at less than 0.1% of the cost.
Can multiple grant managers edit the file at the same time?
The Research Institutions Report in Excel is built for single-user editing. If you need real-time multi-user collaboration, the Google Sheets equivalent or a paid SaaS would be a better fit. For most research offices, a single grant administrator owns the master file and distributes view-only copies to stakeholders.
Does the Research Institutions Report in Excel include sample data?
Yes. The Research Institutions Report in Excel ships with sample project rows on the Data sheet so you can see every chart, KPI card, and slicer in action before replacing the data with your institution’s records. The Support sheet also ships with sample department and funding-source dropdowns you can edit once and reuse.
About the Author
Built by PK — Microsoft Certified Professional with 15+ years of Excel, Google Sheets, and Power BI experience. Founder of NextGenTemplates, reaching 300K+ subscribers across YouTube channels (@PK-AnExcelExpert, @NextGenTemplates, @NeoTechNavigators). Every template is hand-built and tested before release.
Conclusion
The Research Institutions Report in Excel turns multi-hour monthly reporting work into a 10-minute paste-and-refresh workflow. Four sheets, five KPI cards, five pivot-driven charts, two slicers, and a project-level Information Table — all wired together so a single Data sheet edit propagates everywhere. No macros, no add-ins, no SaaS subscription.
👉 Click here to Purchase the Research Institutions Report in Excel
✅ Instant download · One-time payment · No subscription
🎥 For step-by-step video walkthroughs, visit YouTube.com/@PK-AnExcelExpert.
📅 Last updated: May 2026