New: NextGenTemplates Academy - video courses on Excel formulas with AI and Pivot Tables & dashboards. Early-bird: 20% off with code EARLYBIRD20 - first 20 orders only.See the courses →
PKComments Off on Regional Sales Analysis Dashboard in Excel
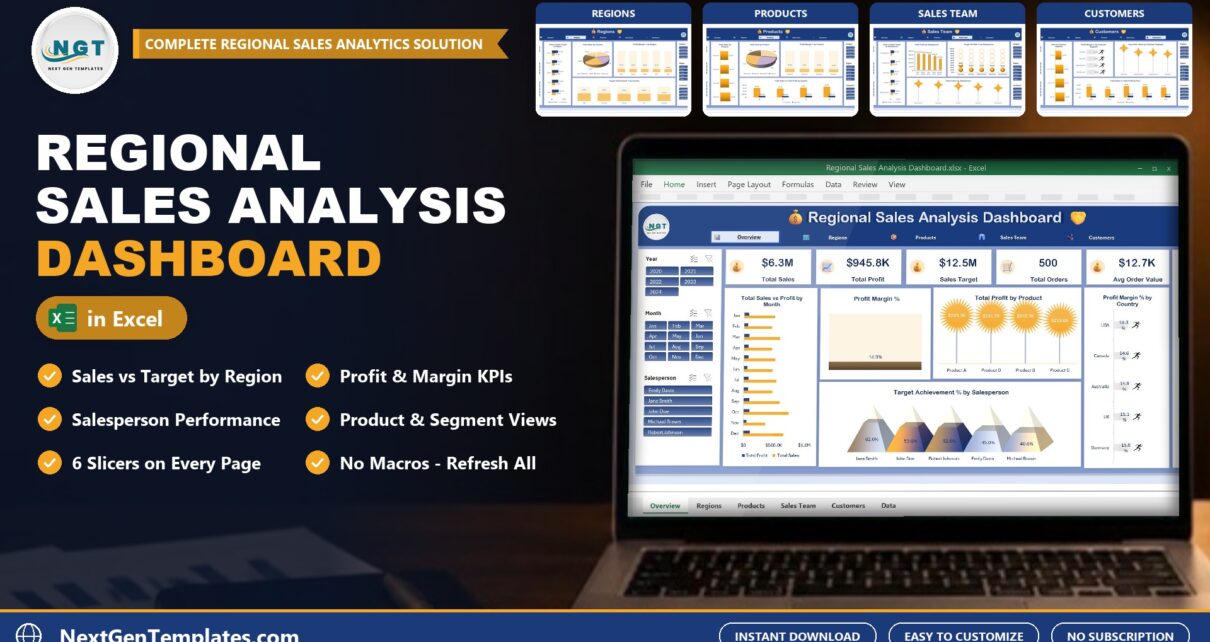
Sales numbers are easy to collect and hard to read. The Regional Sales Analysis Dashboard in Excel takes a plain list of sales records and shows which regions, products and
PKComments Off on Building a Sales Dashboard in Excel: Pivot Tables, Slicers, and Pivot Charts
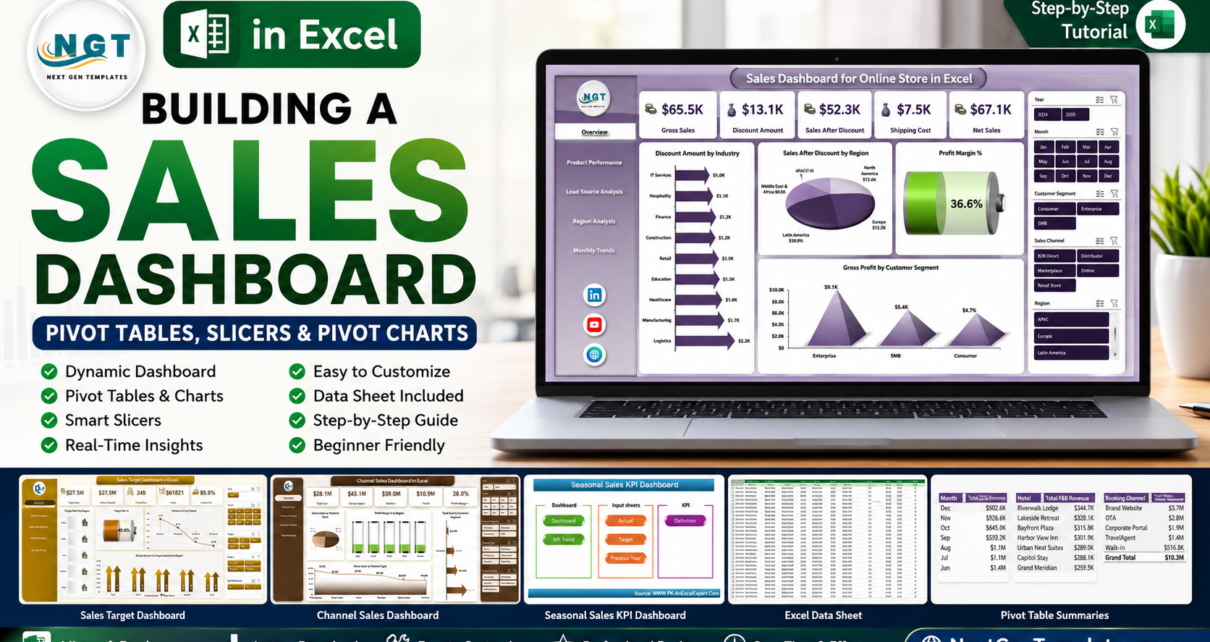
A sales dashboard in Excel works best when PivotTables do the heavy lifting first, slicers control the questions, and Pivot Charts turn the answers into a dashboard view. Excel gives
PKComments Off on Toy and Games Industry Dashboard in Excel
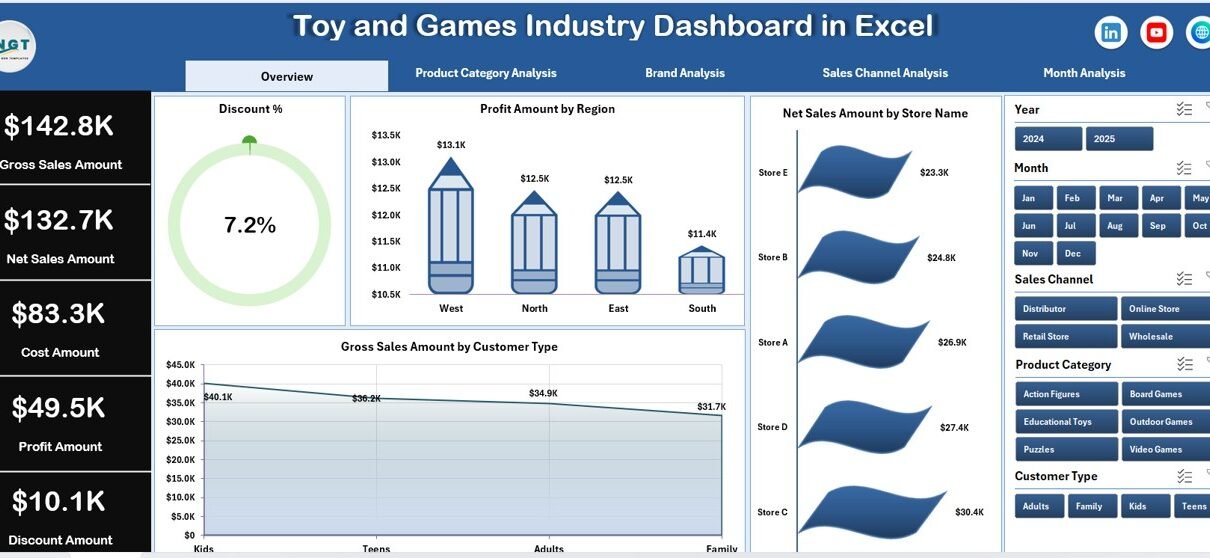
The toy and games industry moves fast. Customer preferences change quickly, seasonal demand impacts sales heavily, and margins depend on smart pricing and discount strategies. Because of this, businesses in
PKComments Off on Furniture Retail Dashboard in Excel
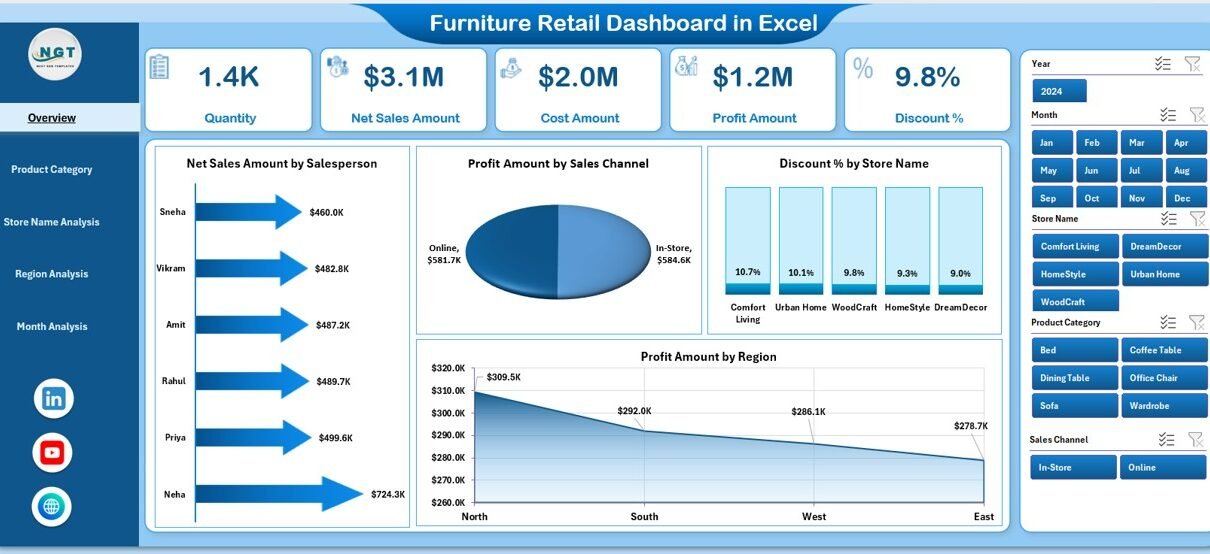
Managing a furniture retail business involves more than selling sofas, beds, and dining tables. Today, retailers must track sales, profits, discounts, inventory, stores, regions, and seasonal trends in real time.
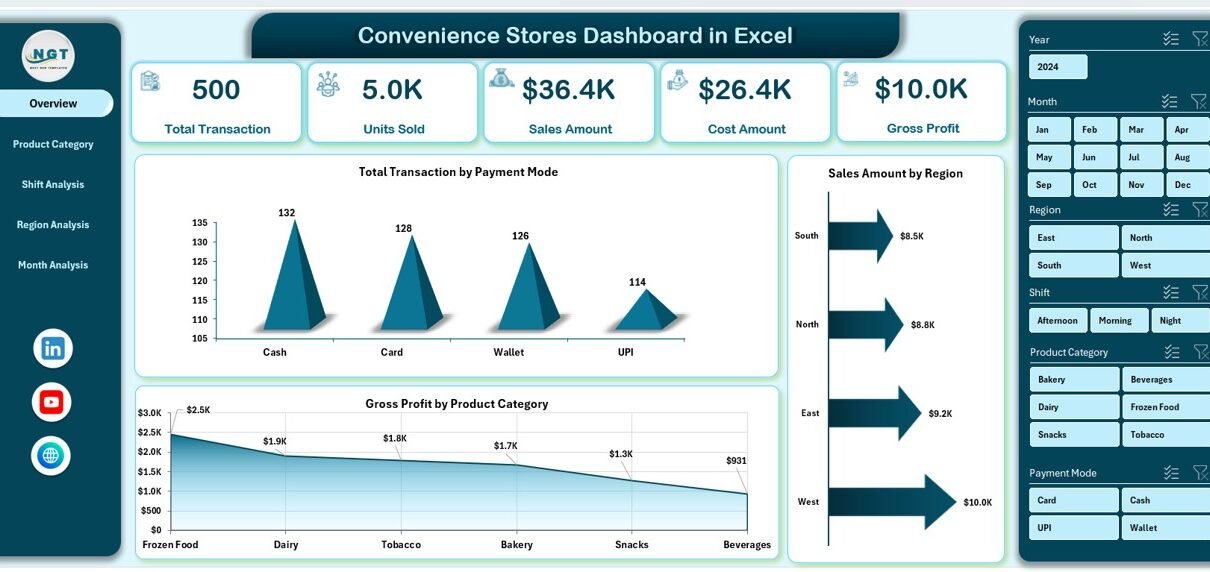
PKComments Off on Convenience Stores Dashboard in Excel
Managing a convenience store involves fast decisions, thin margins, and constant monitoring. However, many store owners and managers still depend on scattered Excel files, daily sales registers, and manual reports.
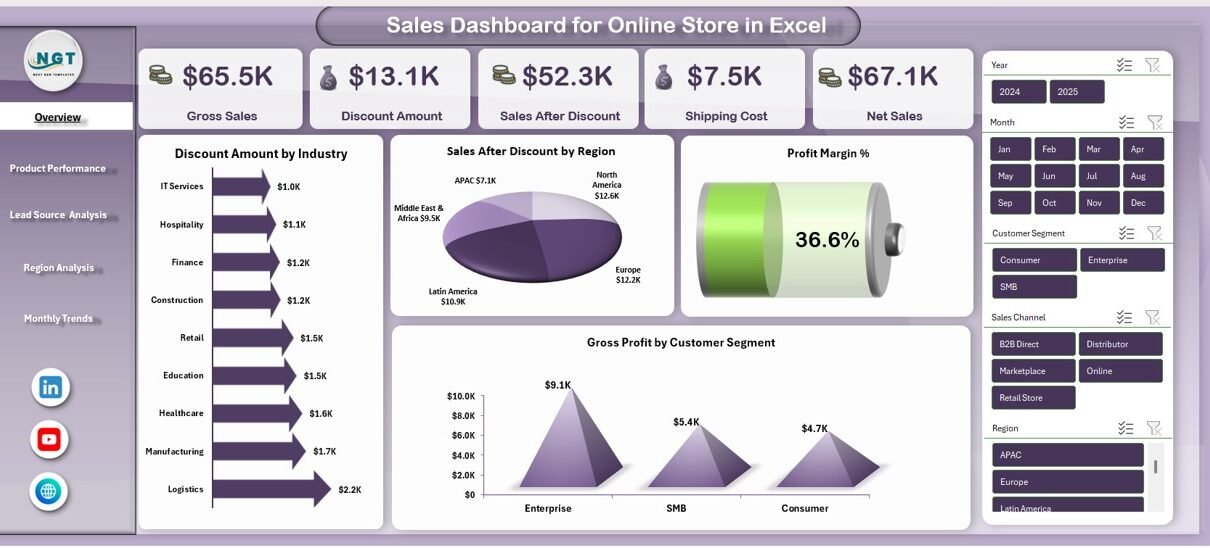
PKComments Off on Sales Dashboard For online Store in Excel
In today’s fast-moving e-commerce world, online store owners must make quick and accurate decisions. However, when sales data stays scattered across invoices, order files, and raw spreadsheets, tracking performance becomes
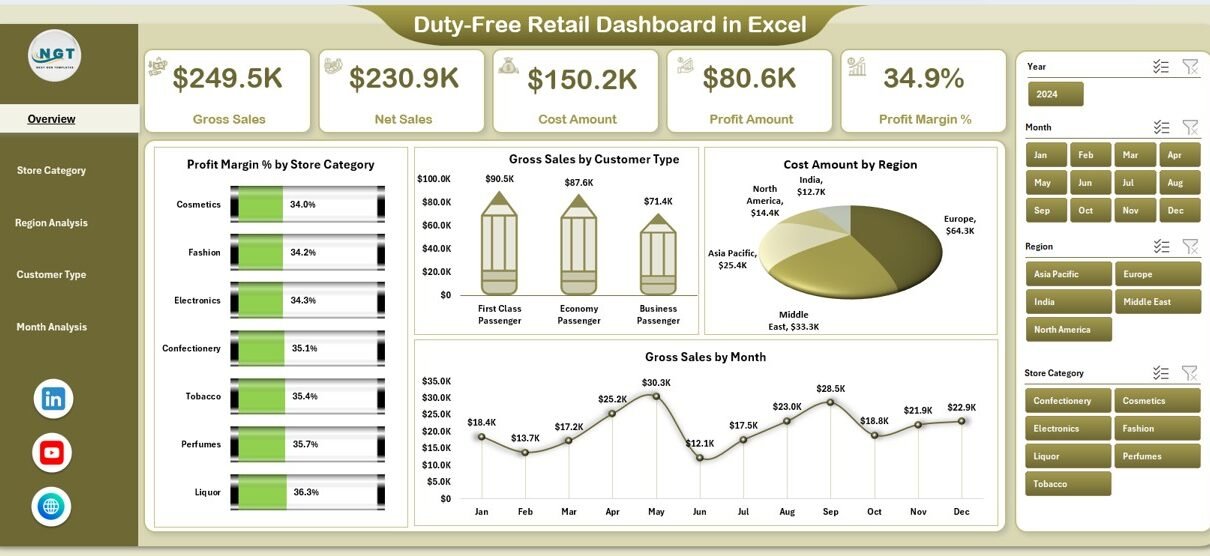
PKComments Off on Duty-Free Retail Dashboard in Excel
Duty-free retail operates in a fast-moving, high-value environment. Because customer traffic fluctuates daily, margins vary by product and region, and costs remain tightly controlled, decision-makers need instant visibility into performance.
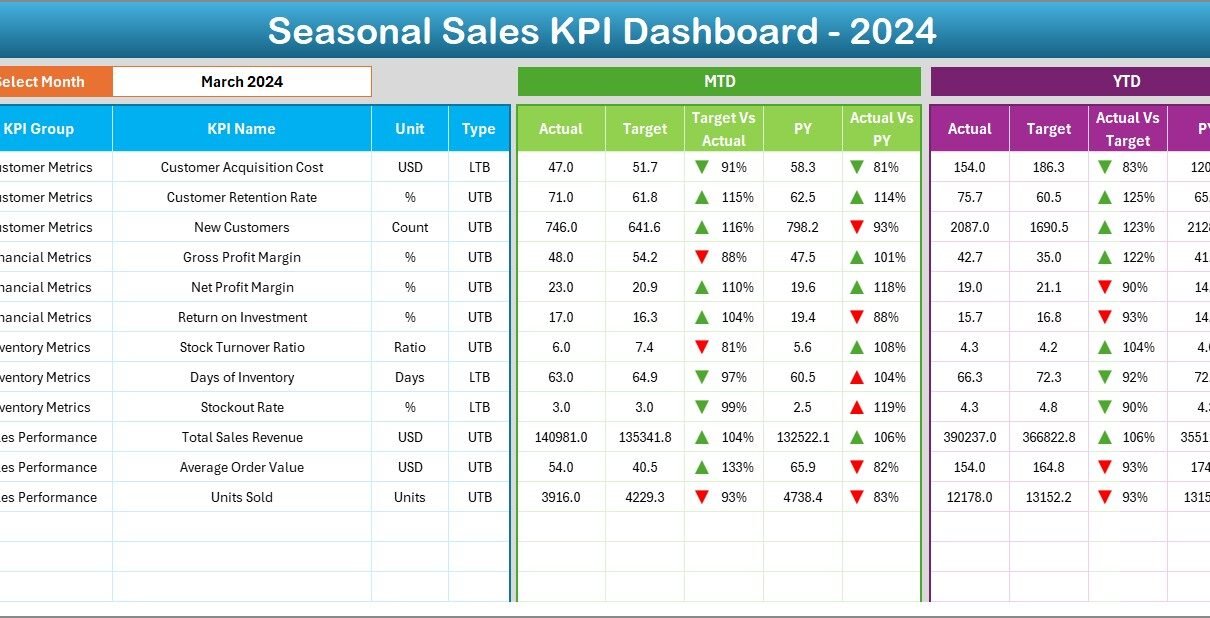
PKComments Off on Seasonal Sales KPI Dashboard In Excel
Seasonal sales can make or break the profitability of many businesses. Whether you run a retail store, an e-commerce business, or a wholesale operation, demand often fluctuates with time. For
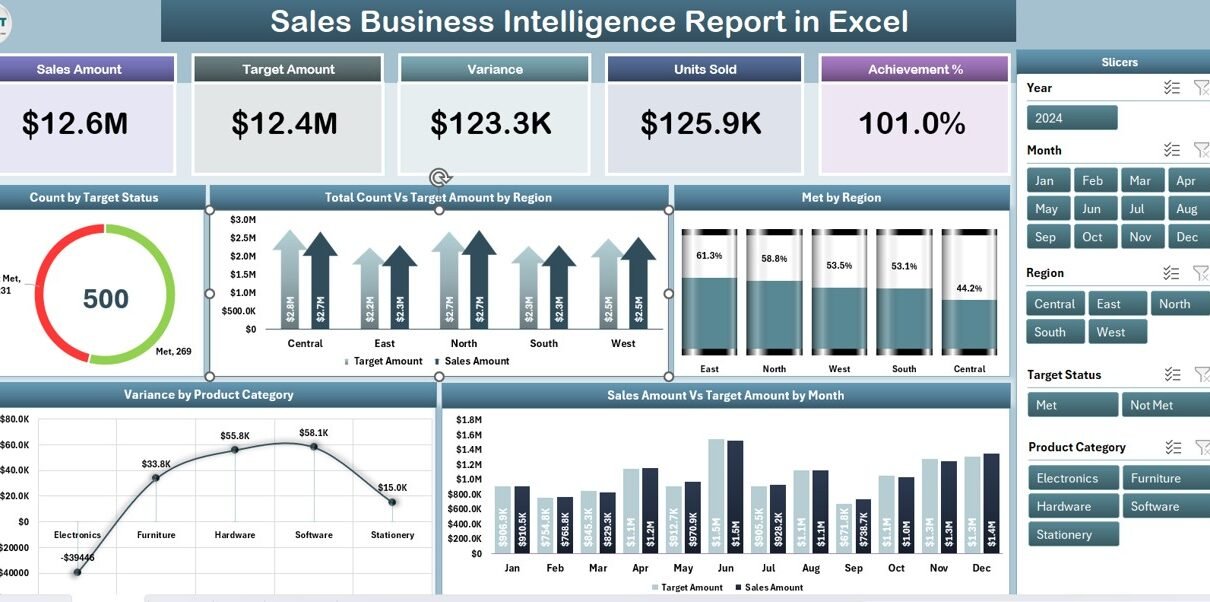
PKComments Off on Sales Business Intelligence Report in Excel
In today’s competitive business world, sales teams cannot rely on guesswork. Data is the fuel that drives informed decisions, accurate forecasting, and sustainable growth. A Sales Business Intelligence (BI) Report