Candle Infographic Chart in Excel: Step-by-Step Tutorial
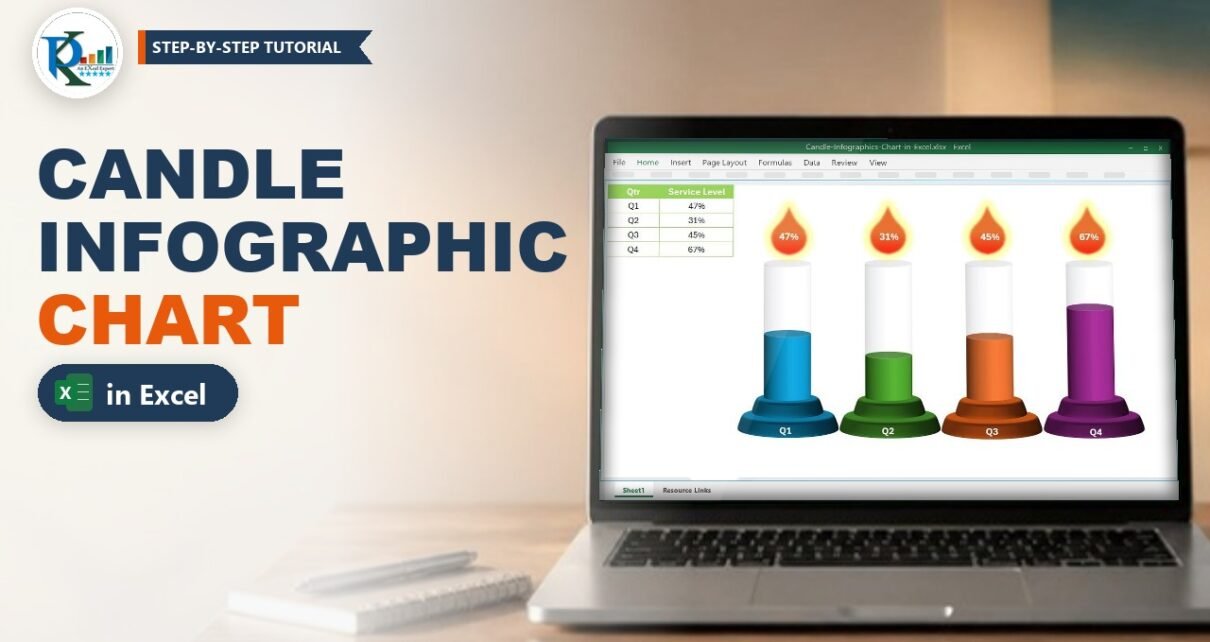
A candle infographic chart in Excel turns four plain percentages into four glowing candles: the coloured wax shows the value, the flame on top shows the number, and the whole
Transforming Data into Decisions