New: NextGenTemplates Academy - video courses on Excel formulas with AI and Pivot Tables & dashboards. Early-bird: 20% off with code EARLYBIRD20 - first 20 orders only.See the courses →
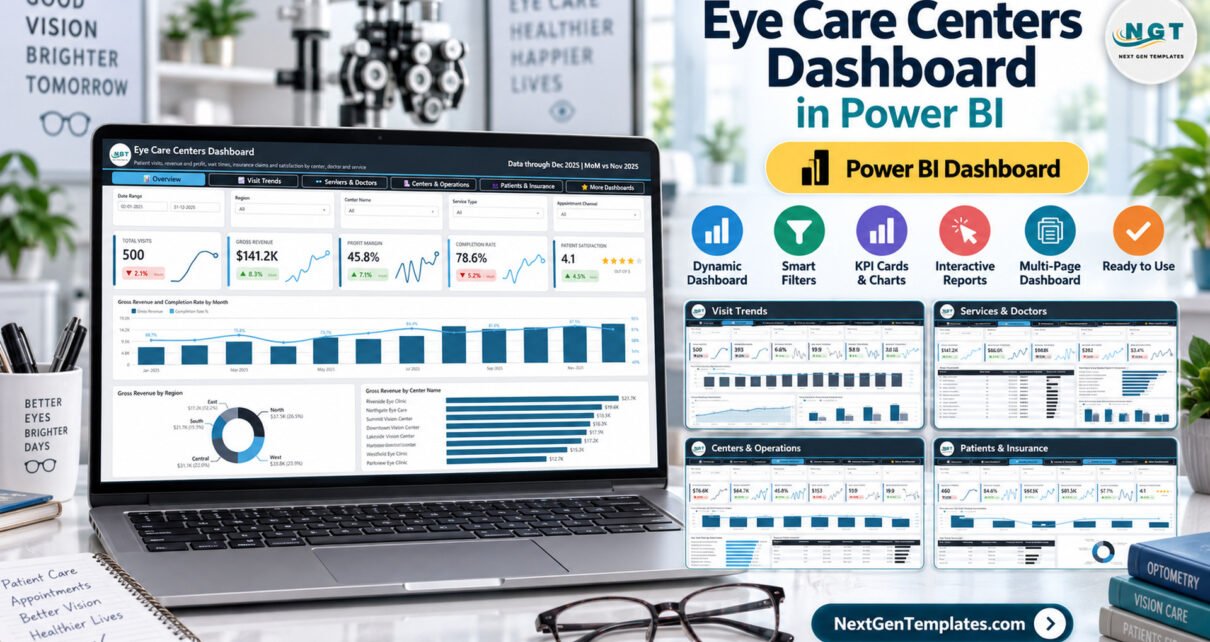
PKComments Off on Eye Care Centers Dashboard in Power BI
The Eye Care Centers Dashboard in Power BI analyses 500 sample patient visits recorded across 8 eye care centers, 5 regions and 12 doctors during 2025. It packs 25 KPI
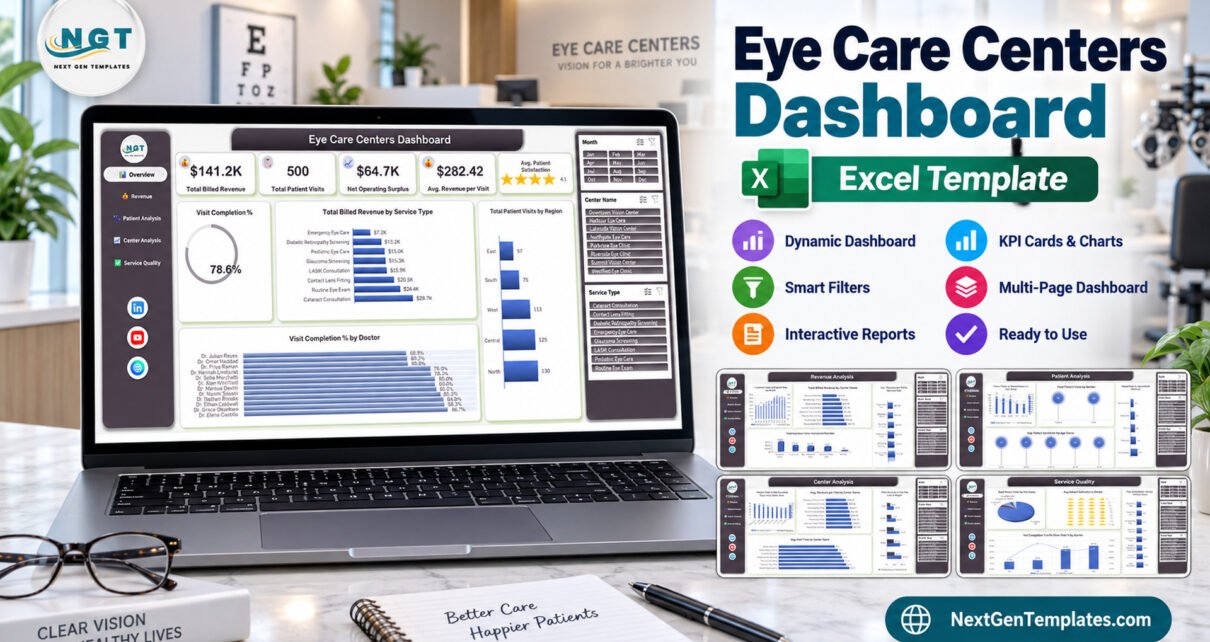
PKComments Off on Eye Care Centers Dashboard in Excel
Running more than one eye-care site turns a simple question into an awkward one. A single clinic owner can feel how the month went. Put eight centers across five regions
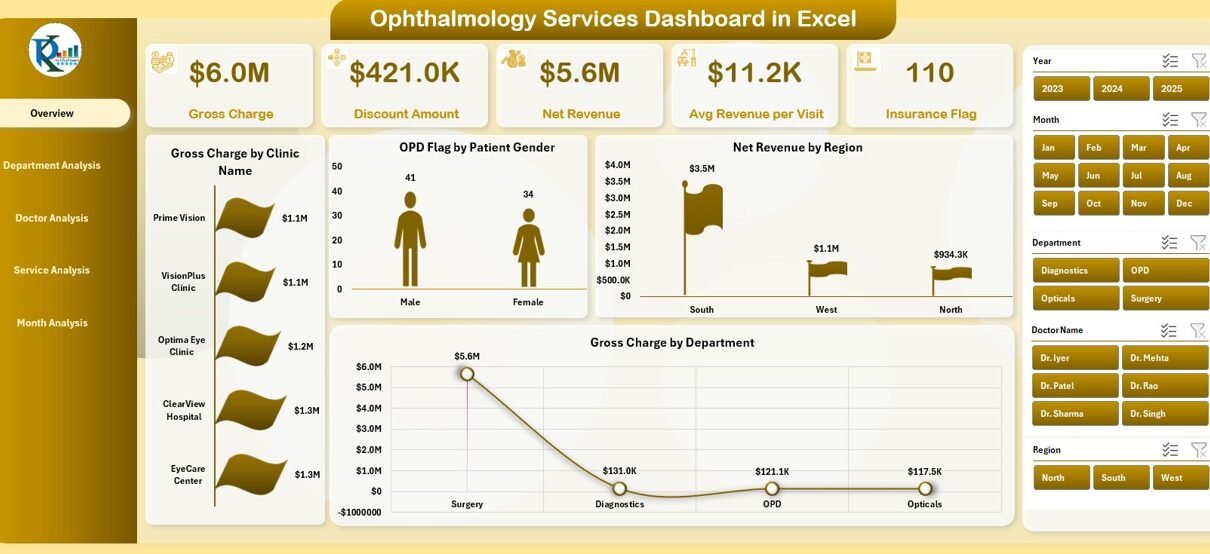
PKComments Off on Ophthalmology Services Dashboard in Excel
Managing an ophthalmology clinic involves more than providing quality eye care. Clinics must also track visits, surgeries, revenue, insurance cases, and departmental performance. However, when data stays scattered across multiple