New: NextGenTemplates Academy - video courses on Excel formulas with AI and Pivot Tables & dashboards. Early-bird: 20% off with code EARLYBIRD20 - first 20 orders only. See the courses →
  • Learn Excel (Free Course)
    • 1. Shortcut Keys
    • 2. Fill & Flash Fill
    • 3. Find & Replace
    • 4. Sort & Filter
    • 5. Formulas & Functions
    • 6. Data Validation
    • 7. Conditional Formatting
    • 8. Basic Charts
    • 9. Advanced Charts
    • 10. Pivot Tables
    • 11. Excel Dashboards
    • 12. VBA Course
    • 13. Excel Formulas with AI
  • Templates
  • Tutorials
    • Charts and Visualization
    • VBA
    • Excel Tips and Tricks
    • Excel Dashboards
    • Power Pivot & DAX
  • Power BI
  • Template Store
    • Ready to Use Templates
  • Courses
  • Academy
    • Excel + AI Mastery: 100 Formulas
    • Excel Pivot Tables & Dashboards
  • About Us
  • Contact Us

PK: An Excel Expert

Transforming Data into Decisions

Tag: financial analysis

Dashboard

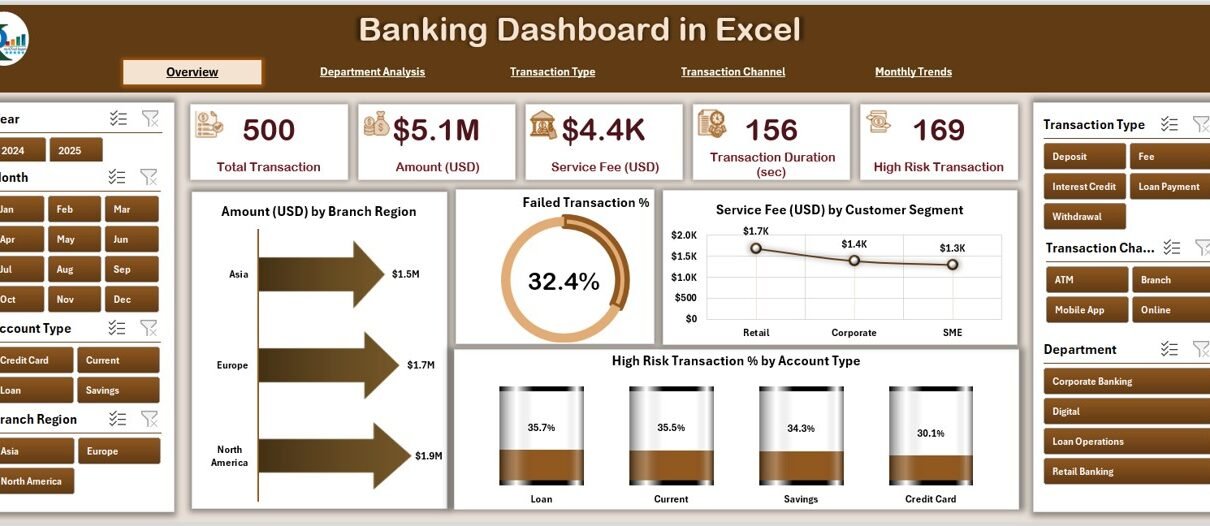
Banking Dashboard in Excel

October 14, 2025October 14, 2025 PKComments Off on Banking Dashboard in Excel
The banking industry runs on data — from customer transactions to branch profitability. However, with data spread across multiple reports, spreadsheets, and systems, decision-making often becomes slow and complex.A Banking
Read More
Templates

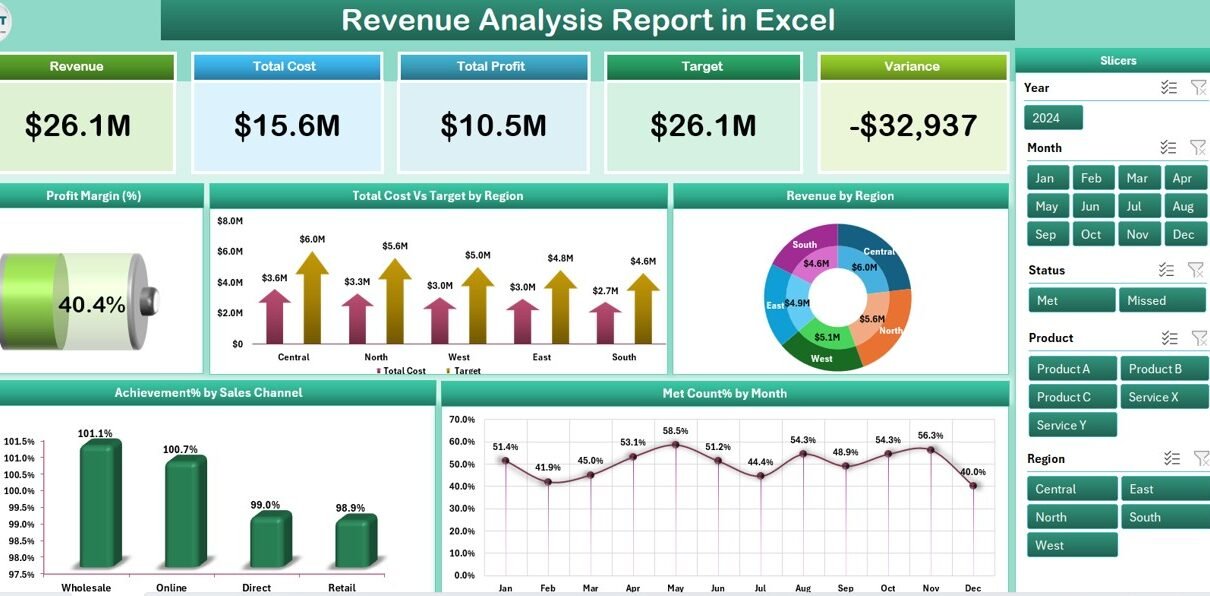
Revenue Analysis Report in Excel

August 7, 2025August 7, 2025 PKComments Off on Revenue Analysis Report in Excel
In today’s data-driven world, businesses must stay on top of their financial performance to remain competitive. Revenue is one of the most critical metrics for any organization. It reflects business
Read More
Power BI

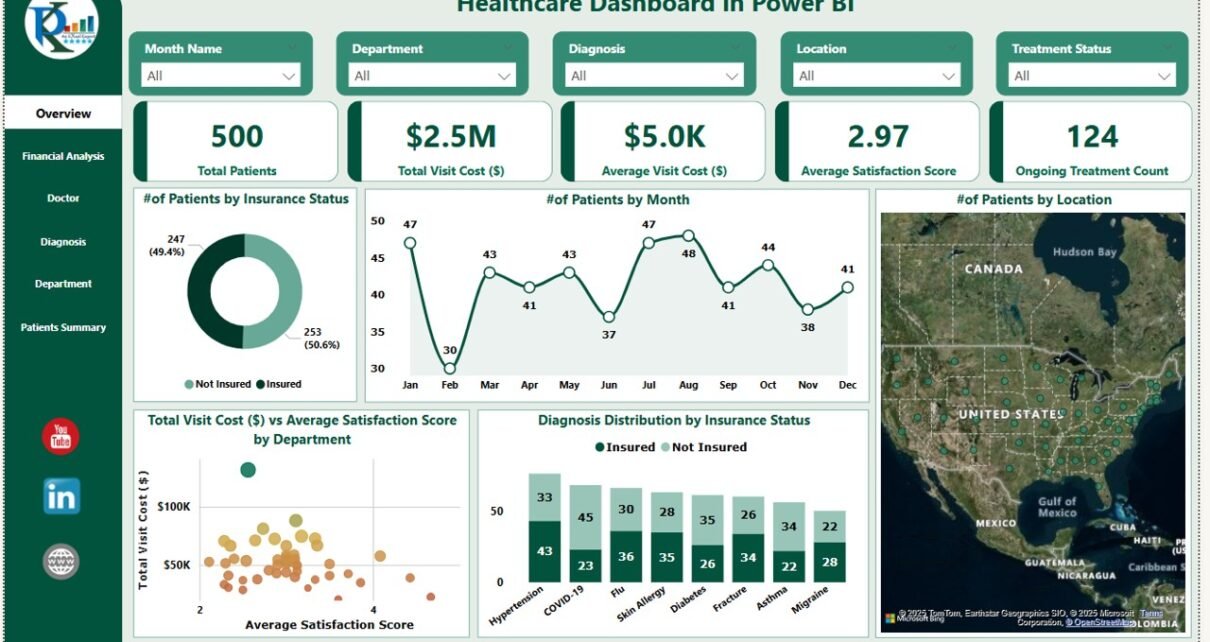
Healthcare Dashboard in Power BI

June 23, 2025June 23, 2025 PKComments Off on Healthcare Dashboard in Power BI
In the healthcare industry, data-driven decisions are essential for improving patient care, managing costs, and optimizing operations. The Healthcare Dashboard in Power BI provides a ready-to-use solution for healthcare providers,
Read More
Dashboard

Finance and Accounting Performance KPI Dashboard in Excel

April 18, 2025April 18, 2025 PKComments Off on Finance and Accounting Performance KPI Dashboard in Excel
In the fast-paced world of business, tracking financial performance is no longer a luxury—it’s a necessity. As businesses grow and evolve, so does the need for real-time visibility into finance
Read More
Dashboard

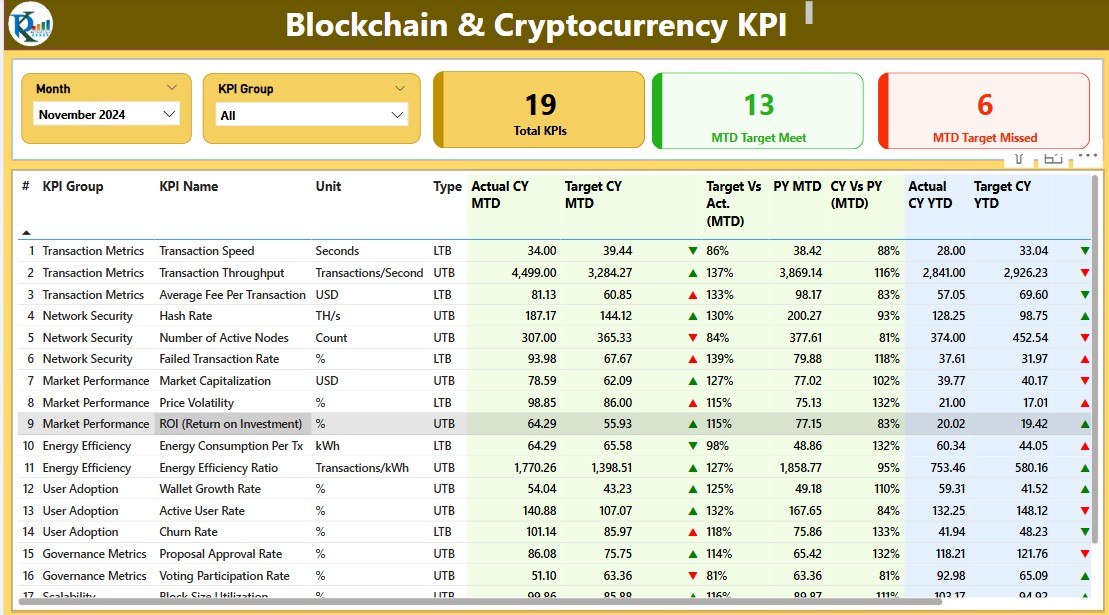
Blockchain & Cryptocurrency KPI Dashboard in Power BI

February 17, 2025March 18, 2025 PKComments Off on Blockchain & Cryptocurrency KPI Dashboard in Power BI
Blockchain & Cryptocurrency KPI Dashboard have revolutionized financial transactions, investment strategies, and data security. To effectively monitor and analyze Blockchain & Cryptocurrency KPI Dashboard performance, a well-structured KPI dashboard is
Read More
Dashboard

Pension Fund KPI Dashboard in Excel

February 8, 2025March 20, 2025 PKComments Off on Pension Fund KPI Dashboard in Excel
Managing pension funds efficiently requires robust tracking of key performance indicators (KPIs). A Pension Fund KPI Dashboard in Excel is a powerful tool that provides real-time insights into fund performance,
Read More
Dashboard

Financial Risk KPI Dashboard in Excel

February 7, 2025March 22, 2025 PKComments Off on Financial Risk KPI Dashboard in Excel
Managing financial risks is crucial for any business. Tracking key performance indicators (KPIs) helps organizations stay on top of potential risks and make informed decisions. The Financial Risk KPI Dashboard
Read More
Dashboard

Debt-to-Equity Ratio KPI Dashboard in Excel

February 6, 2025March 20, 2025 PKComments Off on Debt-to-Equity Ratio KPI Dashboard in Excel
Managing financial health is crucial for any business. With the Debt-to-Equity Ratio (D/E Ratio) KPI Dashboard in Excel, tracking and analyzing financial stability becomes effortless. This user-friendly template is designed
Read More
Dashboard

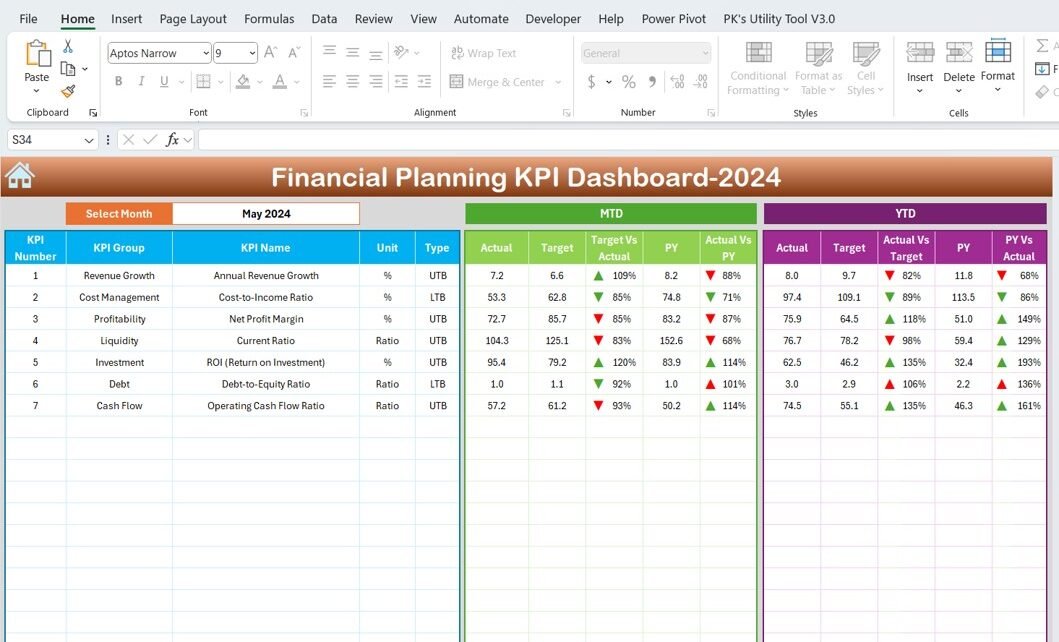
Financial Planning KPI Dashboard in Excel

December 27, 2024April 10, 2025 PKComments Off on Financial Planning KPI Dashboard in Excel
In the ever-evolving world of finance, having immediate access to your performance metrics isn’t just a convenience—it’s a necessity. The Financial Planning Key Performance Indicator (KPI) Dashboard in Excel is
Read More
Dashboard

Private Equity KPI Dashboard in Excel

November 4, 2024March 16, 2025 PKComments Off on Private Equity KPI Dashboard in Excel
Private equity firms today face constant pressure to track their performance effectively, stay on top of targets, and make quick, data-driven decisions. Having a Private Equity KPI Dashboard in Excel
Read More

Posts pagination

Previous 1 2
  • Learn Excel (Free Course)
    • 1. Shortcut Keys
    • 2. Fill & Flash Fill
    • 3. Find & Replace
    • 4. Sort & Filter
    • 5. Formulas & Functions
    • 6. Data Validation
    • 7. Conditional Formatting
    • 8. Basic Charts
    • 9. Advanced Charts
    • 10. Pivot Tables
    • 11. Excel Dashboards
    • 12. VBA Course
    • 13. Excel Formulas with AI
  • Templates
  • Tutorials
    • Charts and Visualization
    • VBA
    • Excel Tips and Tricks
    • Excel Dashboards
    • Power Pivot & DAX
  • Power BI
  • Template Store
    • Ready to Use Templates
  • Courses
  • Academy
    • Excel + AI Mastery: 100 Formulas
    • Excel Pivot Tables & Dashboards
  • About Us
  • Contact Us
Copyright © 2023 PK-AnExcelExpert.com - Privacy Policy